IN A NUTSHELL
AcrHub: an integrative hub for investigating, predicting and mapping anti-CRISPR proteins
Anti-CRISPR proteins (Acrs) promote bacteriophage infection and horizontal gene transfer by inactivating the bacterial host’s CRISPR-Cas defence system. Systematic and in-depth analysis of Acrs will have a wide range of downstream applications, such as gene editing and phage therapy, and be of broad interest to several biology disciplines, especially cell biologists, protein biochemists, and microbiologists. The evolution of new experimental and computational methods has caused a rapid increase in the number of verified and predicted Acrs, but few online resources have been developed to deal with this wealth of information.
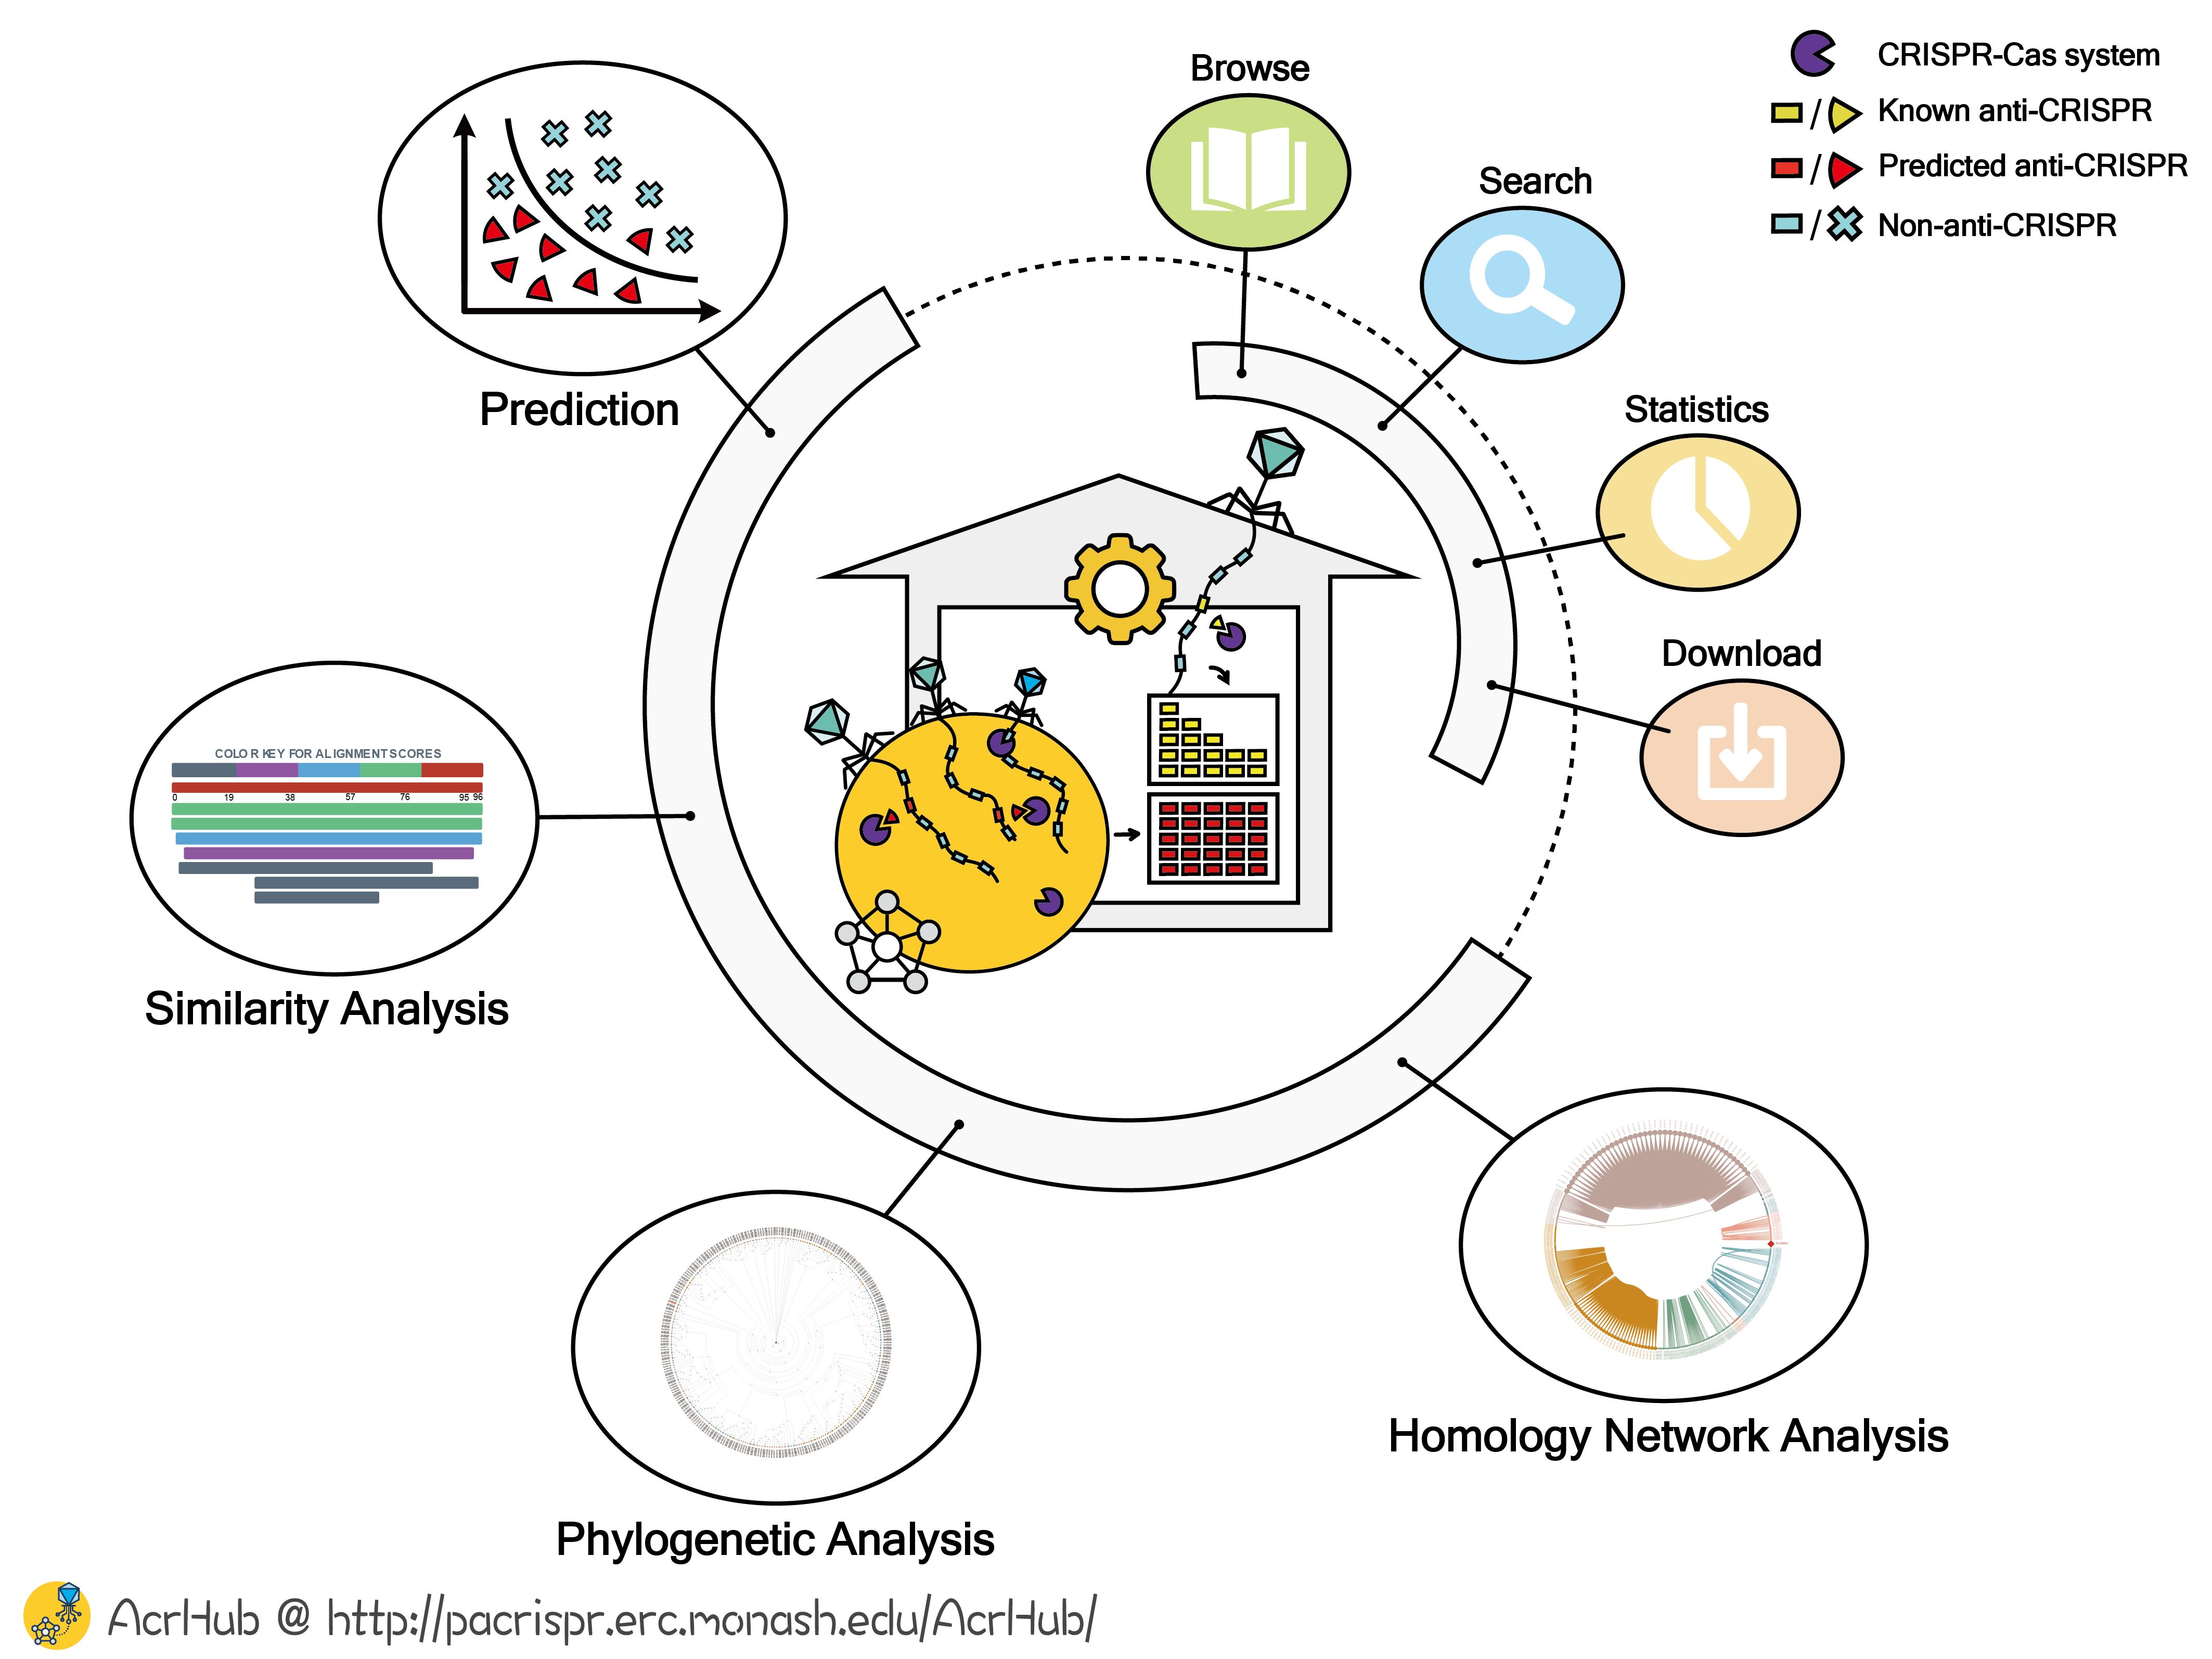
To overcome this shortcoming in a rapidly expanding field, we developed AcrHub, an integrative database to provide an all-in-one user-friendly solution for Acr investigation, prediction and relationship analysis. AcrHub incorporates 339 non-redundant experimentally validated Acrs and over 70,000 predicted Acrs from a diverse range of bacteriophage and bacterial genomes. However, the most important feature of AcrHub is that it facilitates downstream, user-defined analyses by providing numerous analytic and predictive tools. AcrHub integrates state-of-the-art predictors to enable users to predict potential Acrs of their own interests. In addition, three analytic tools that can work both independently and within the AcrHub pipeline are developed to analyze their relationships with known Acrs, including BLAST-based similarity analysis, multiple alignment based phylogenetic analysis and homology-based network analysis. Through interconnecting all modules and tools as a platform, AcrHub presents enriched analysis of known or potential Acrs, allows user-customized Acr prediction and facilitates downstream relationship identifications to infer the potential subtypes and functions of predicted Acrs.
ANTI-CRISPR ANALYSIS
AcrHub provides multiple modules for users to investigate experimentally validated and predicted Acrs.
1.1 Browse
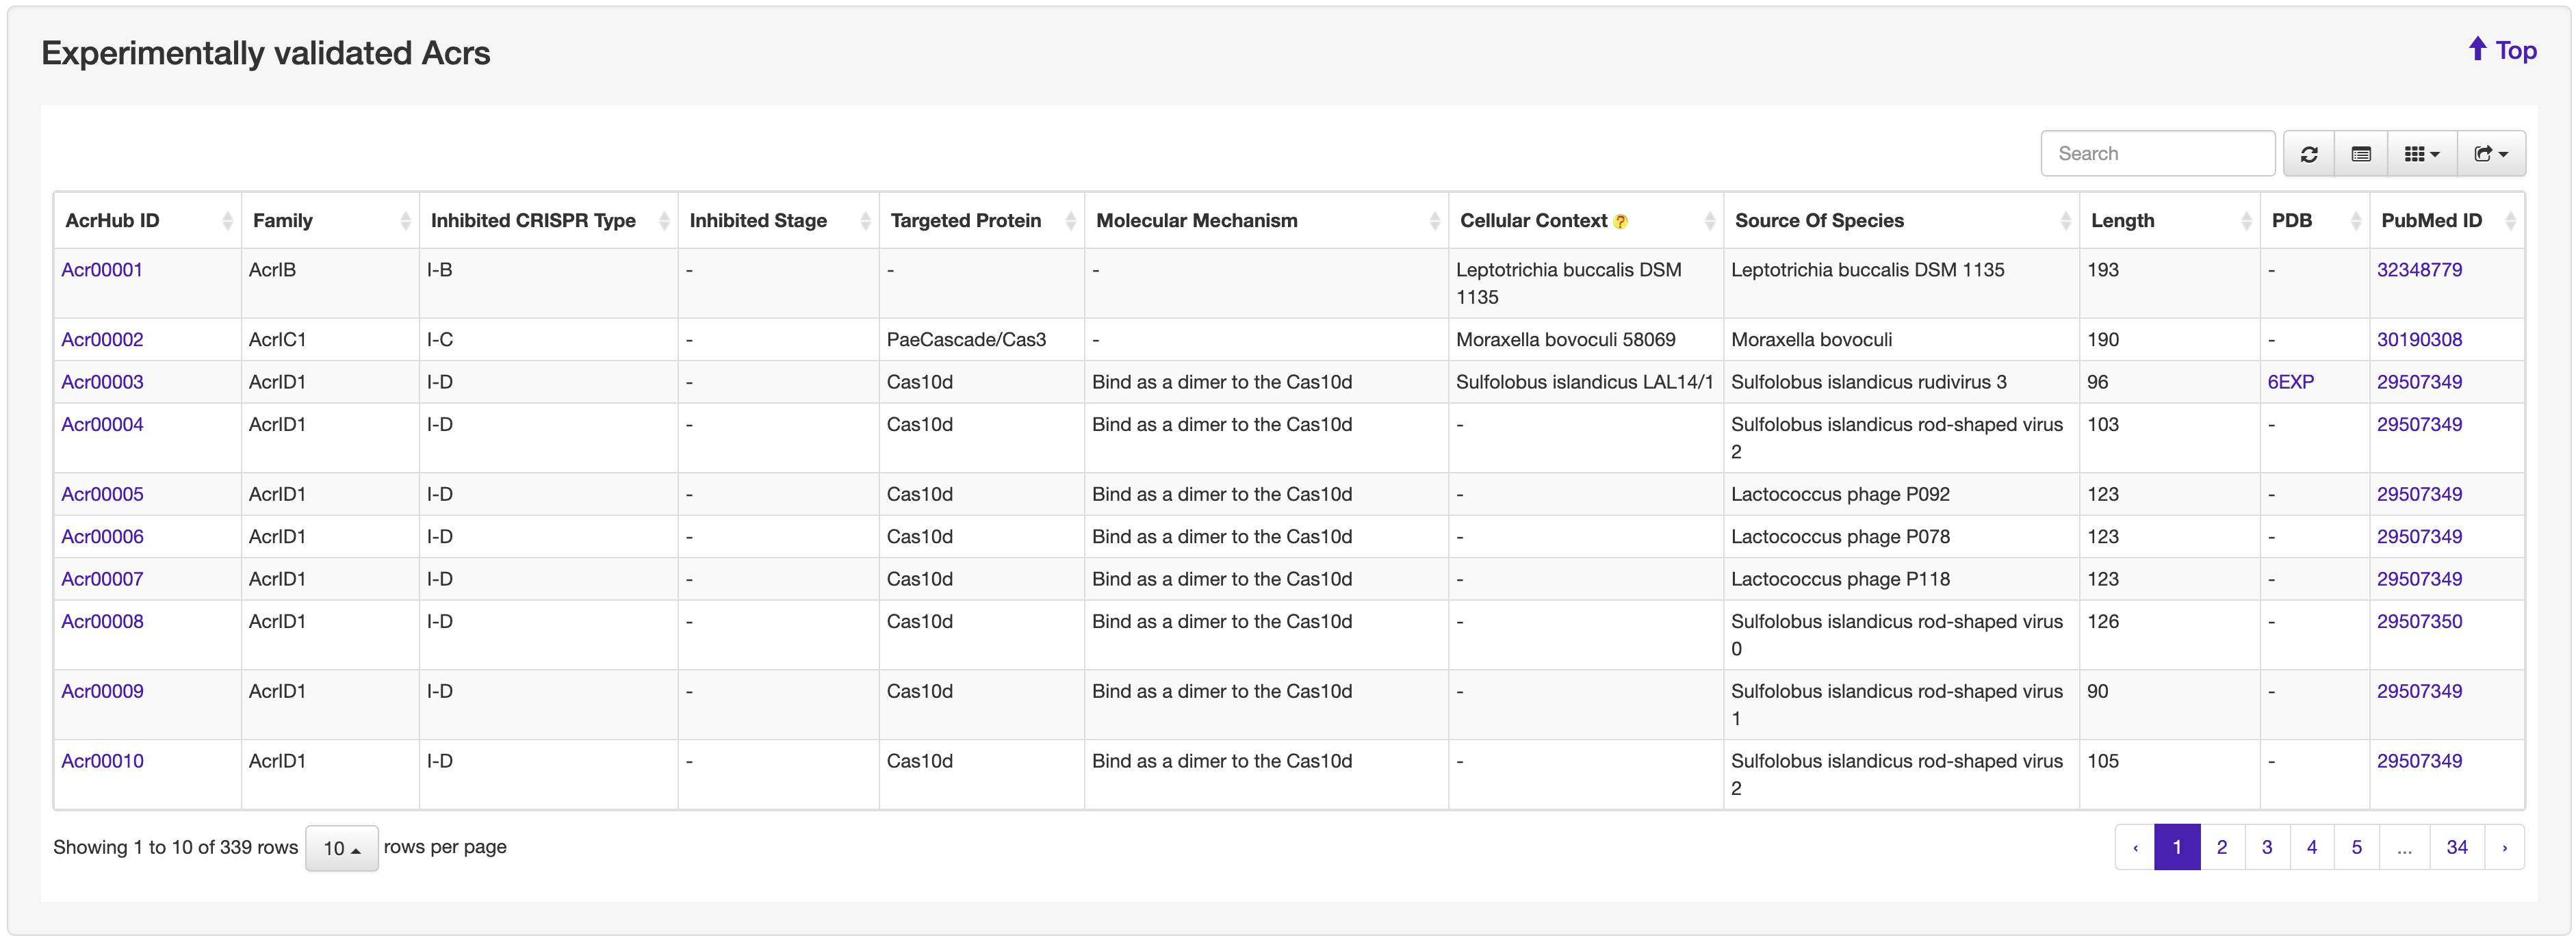
The Browse page of AcrHub presents a list of experimentally validated and predicted Acrs, which can be browsed, resorted, and exported.


1.2 Search
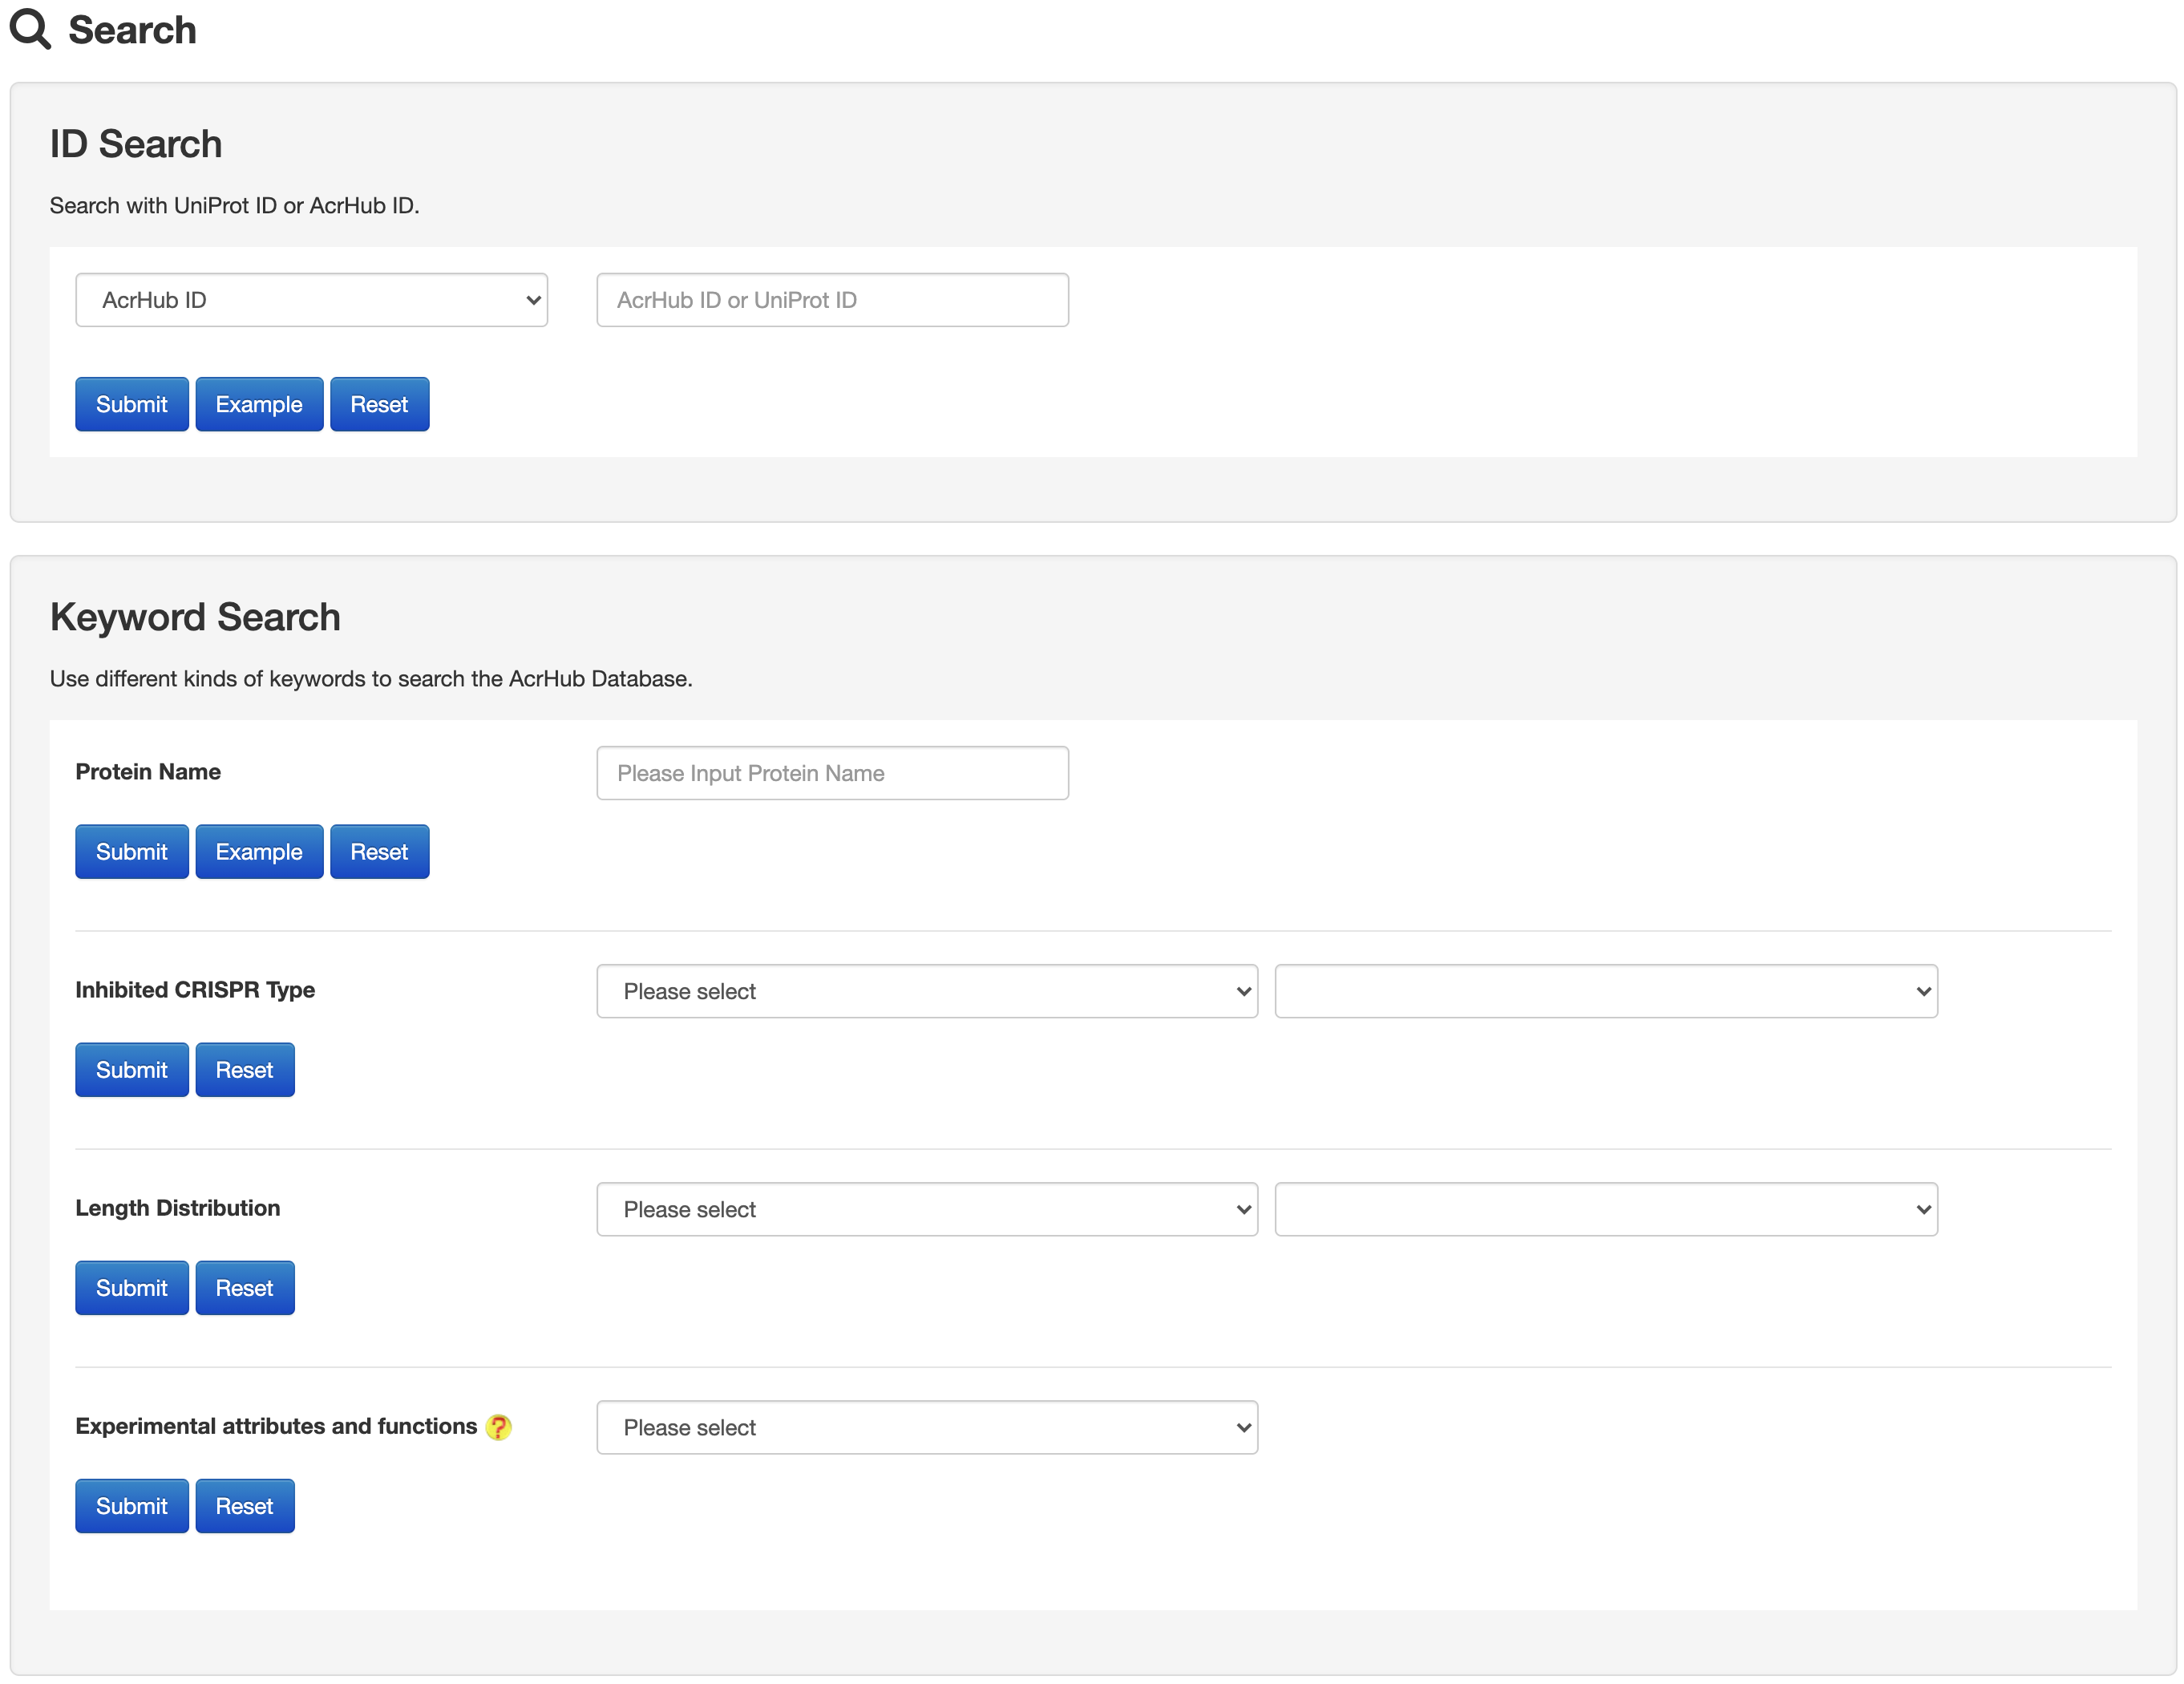
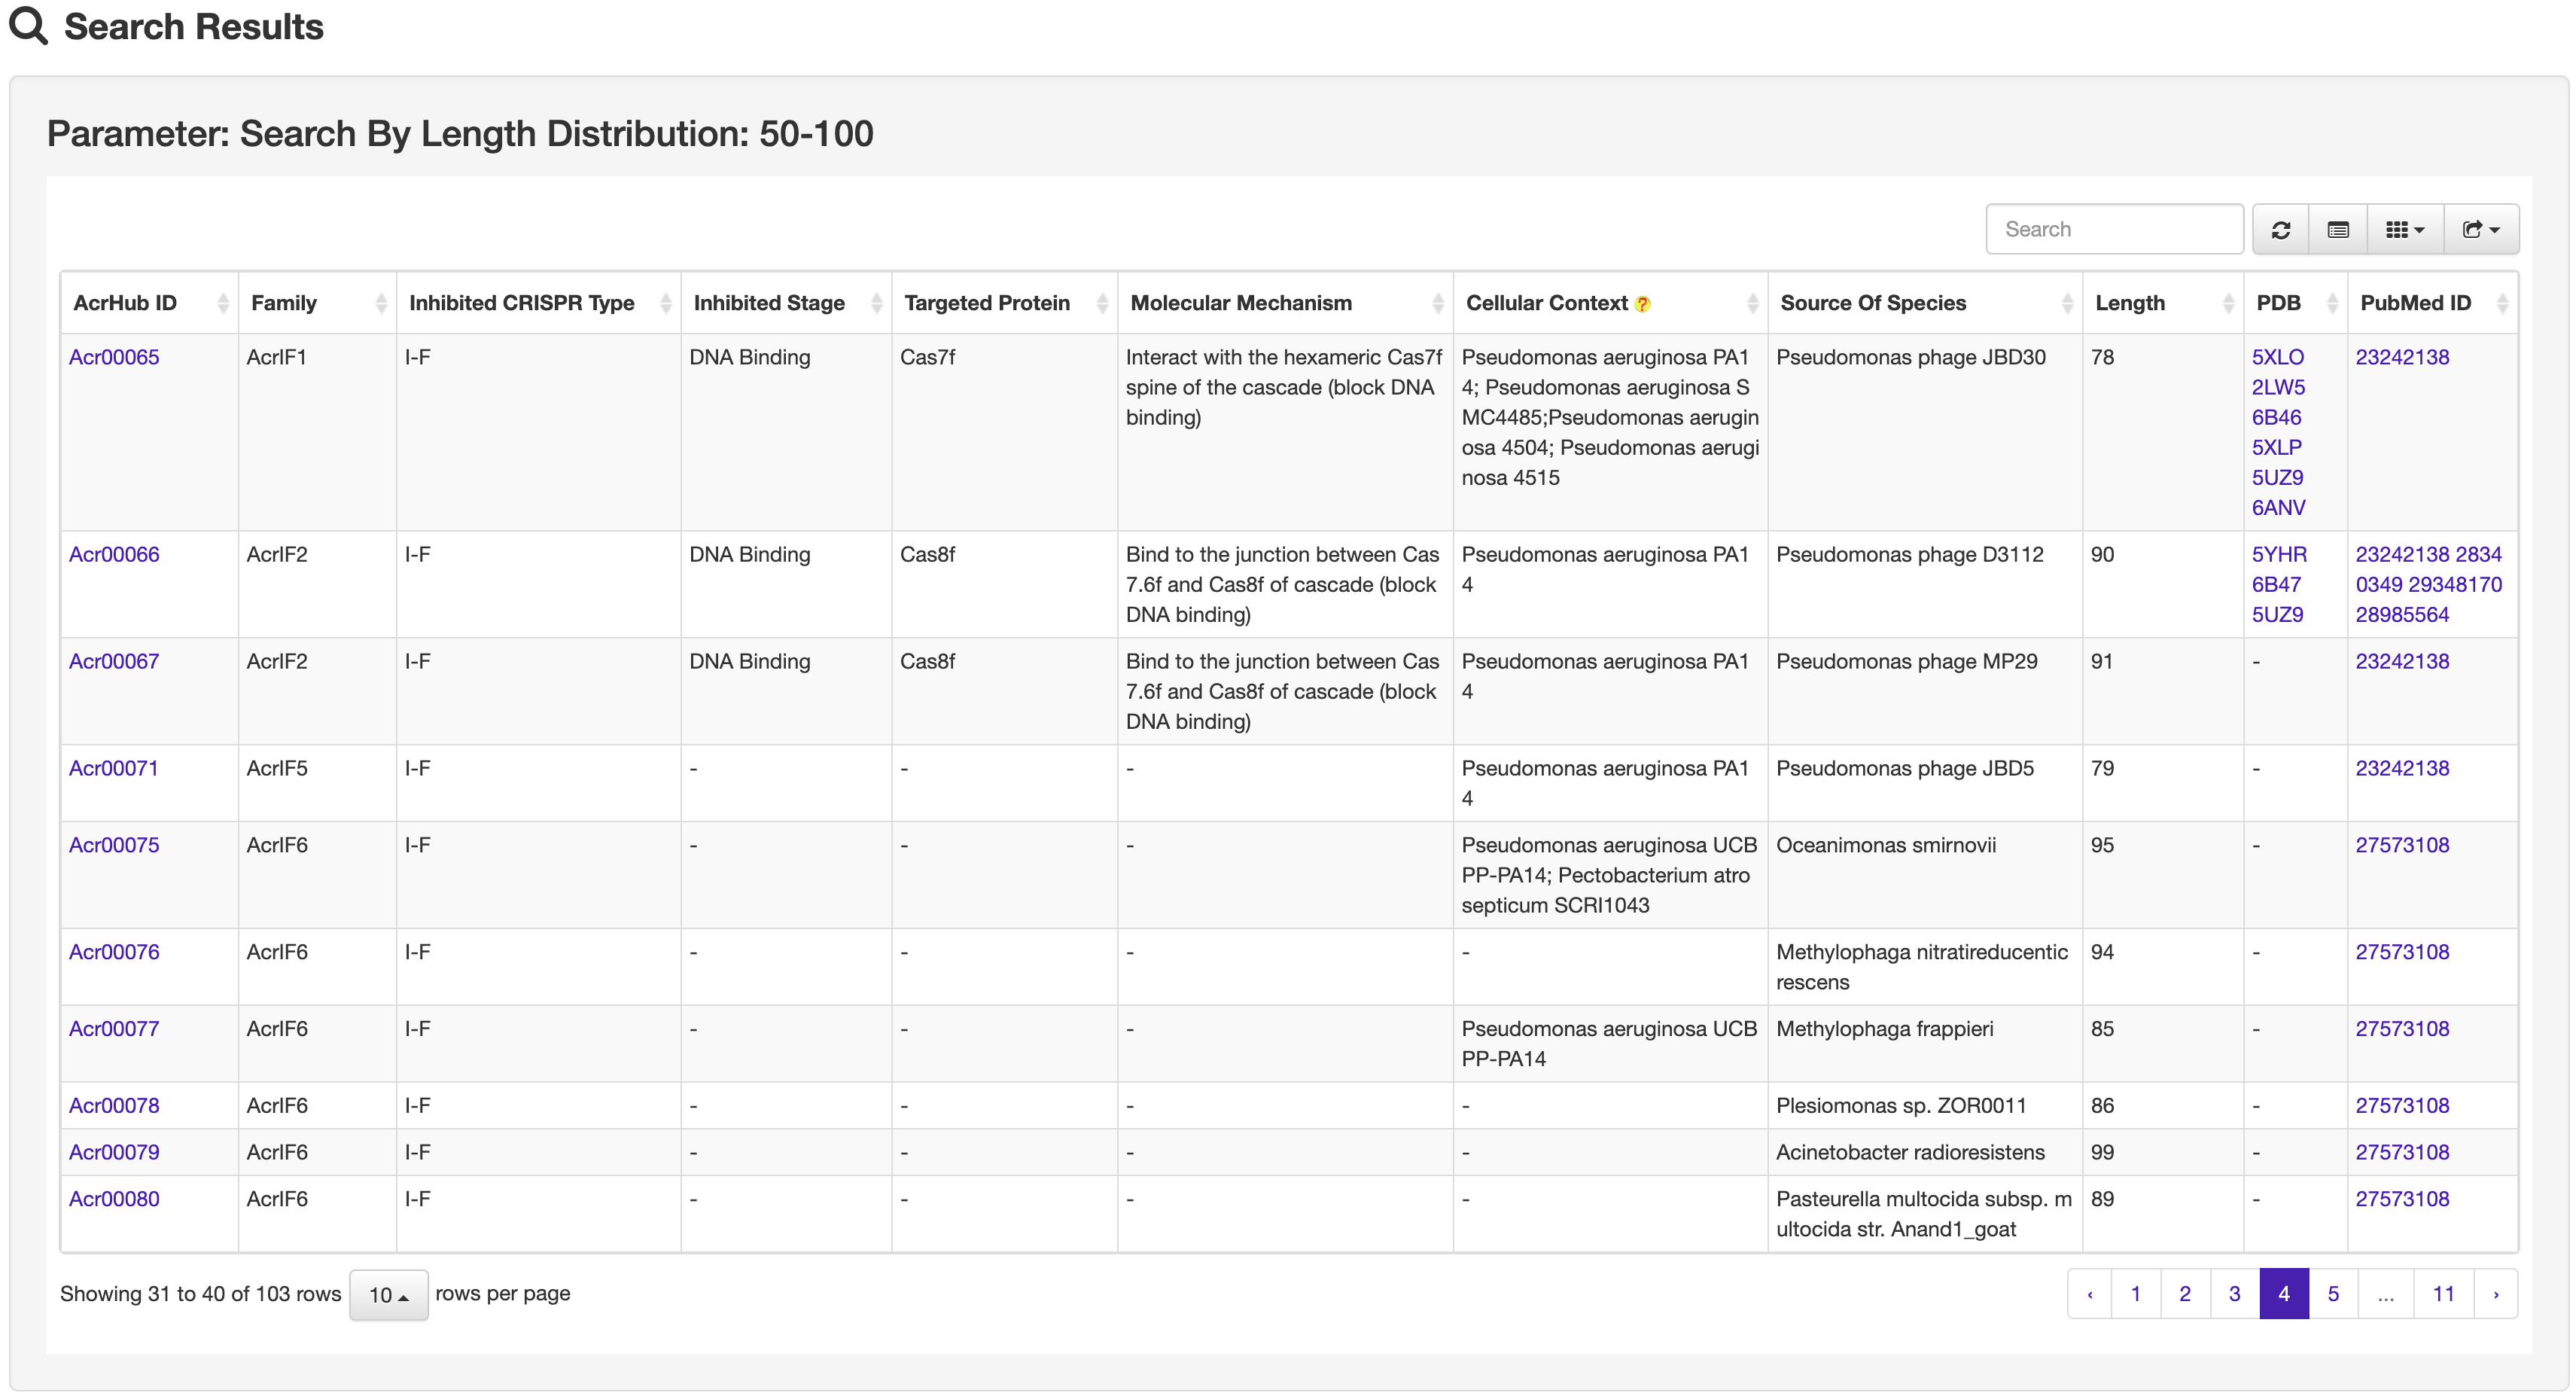
The Search page of AcrHub provides multiple options to search against experimentally validated and predicted Acrs, including ID, protein name, inhibited CRISPR type and length distribution.
1.3 Statistics
The Statistics page of AcrHub provides multiple options for visualizing all of the experimentally validated and predicted Acrs within the database, including sequence distribution maps using their inhibited CRISPR types, sequence length and species of origin.
-
1.3.1 Distribution of experimentally validated Acrs according to their inhibited CRISPR types

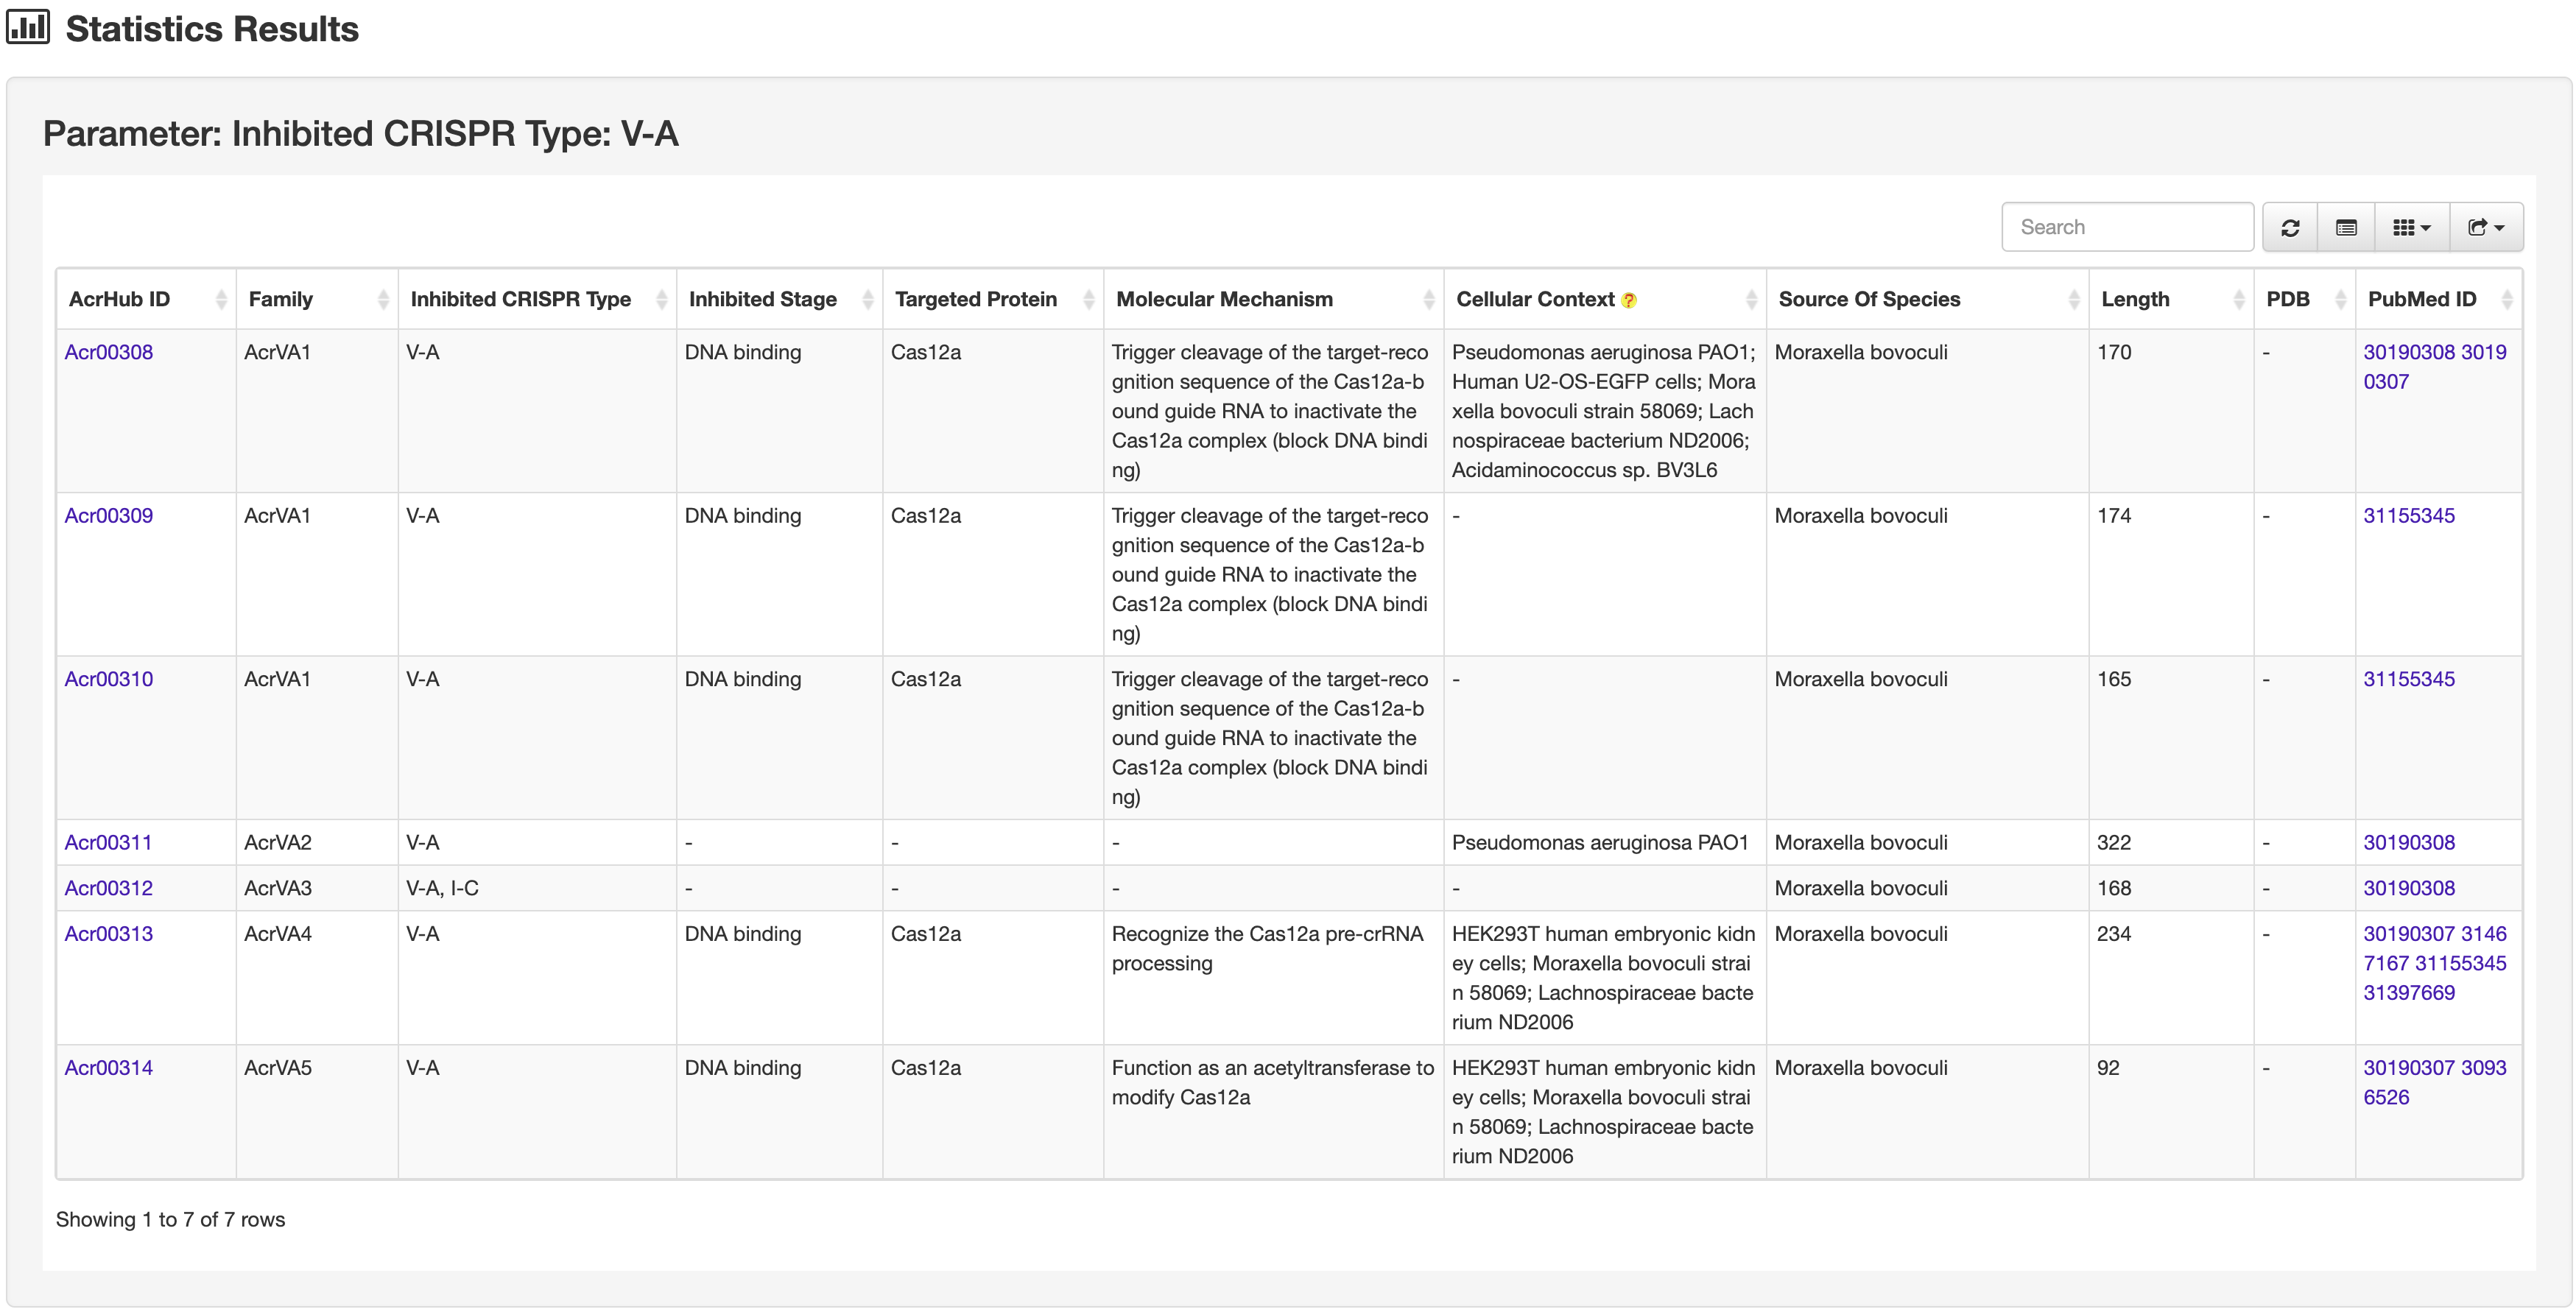
Clicking each section of the pie chart will redirect users to a statistics results page listing the filtered Acrs, presented in a similar way to the search results page.
-
1.3.2 Distribution of predicted Acrs according to their inhibited CRISPR types

-
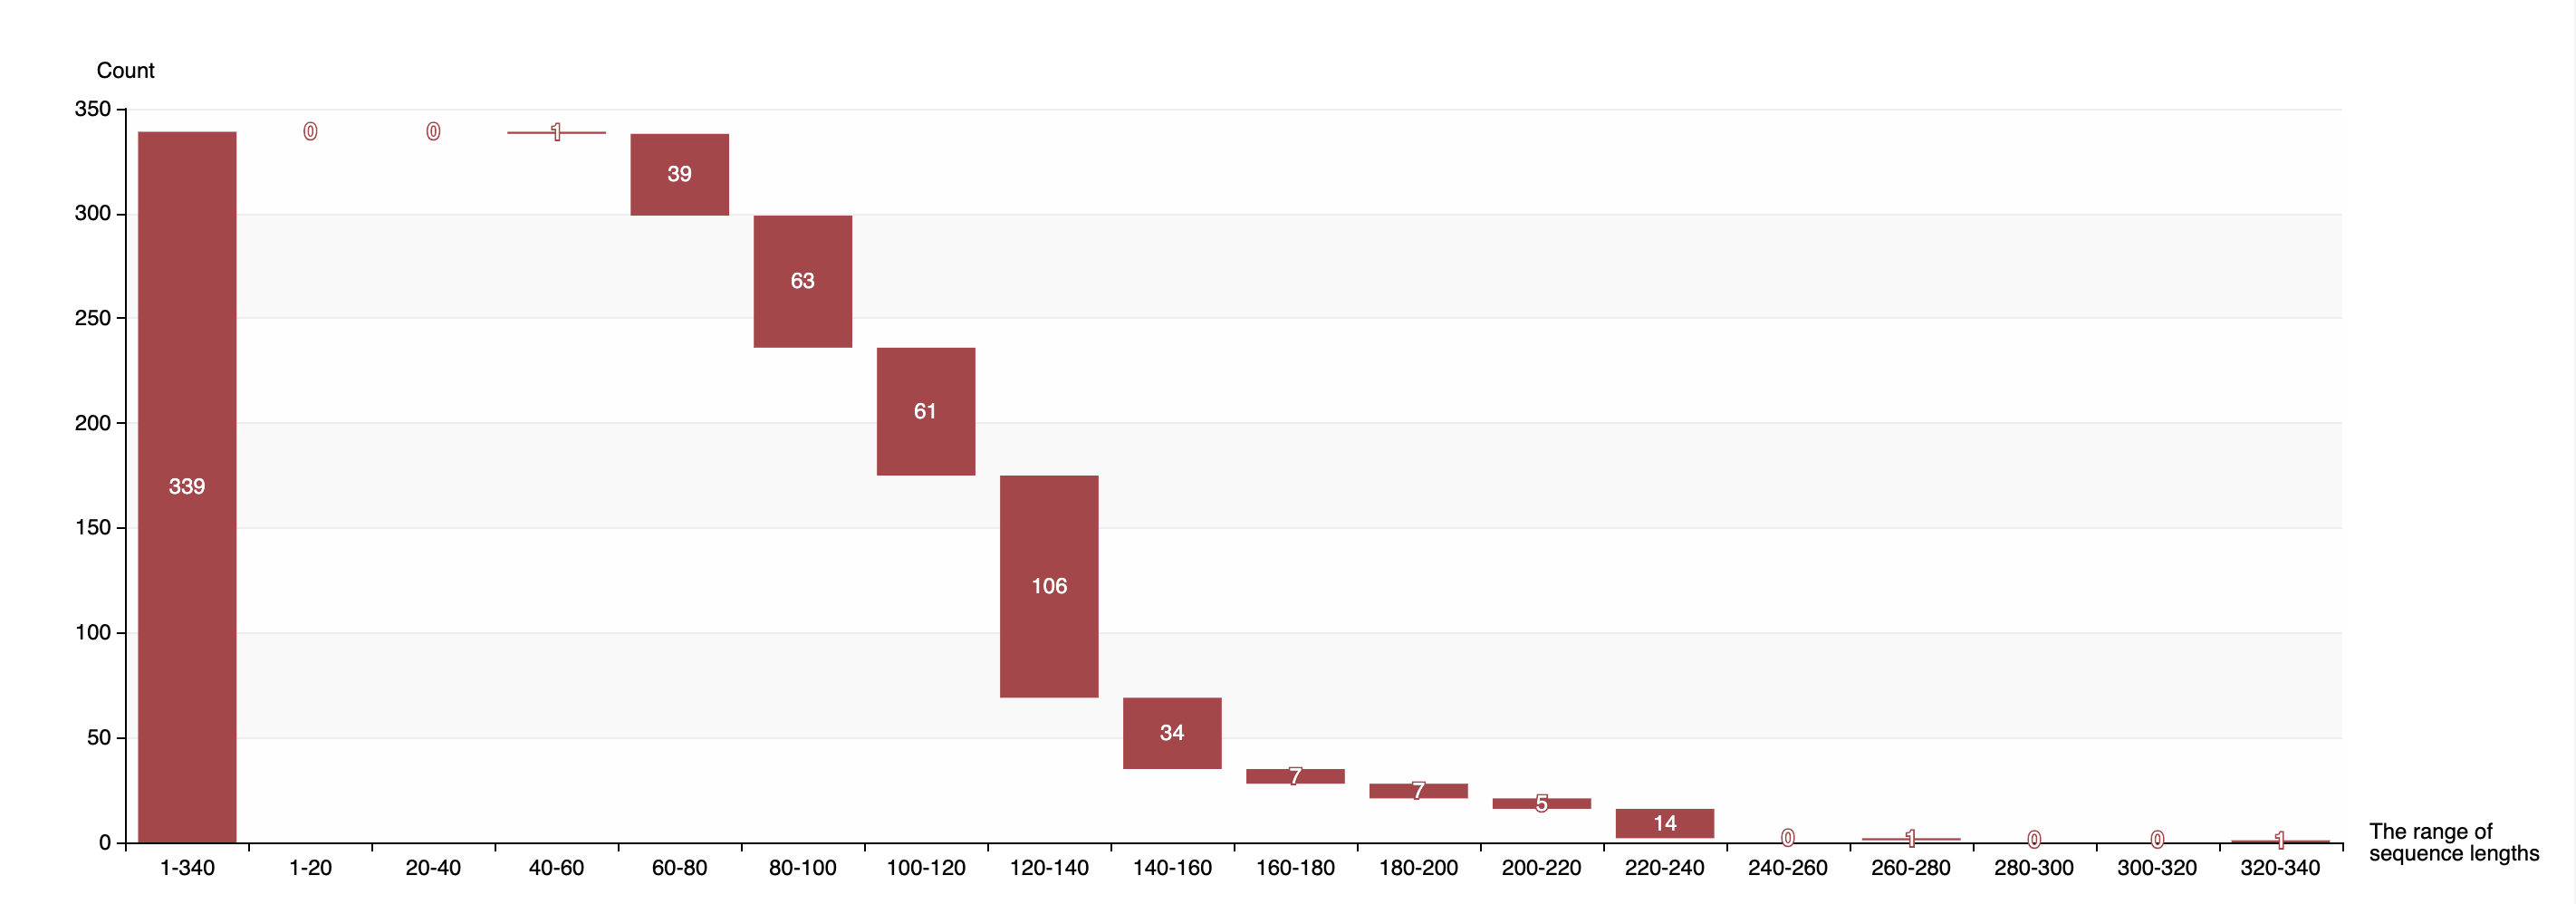
1.3.3 Distribution of sequence lengths of experimentally validated Acrs
-
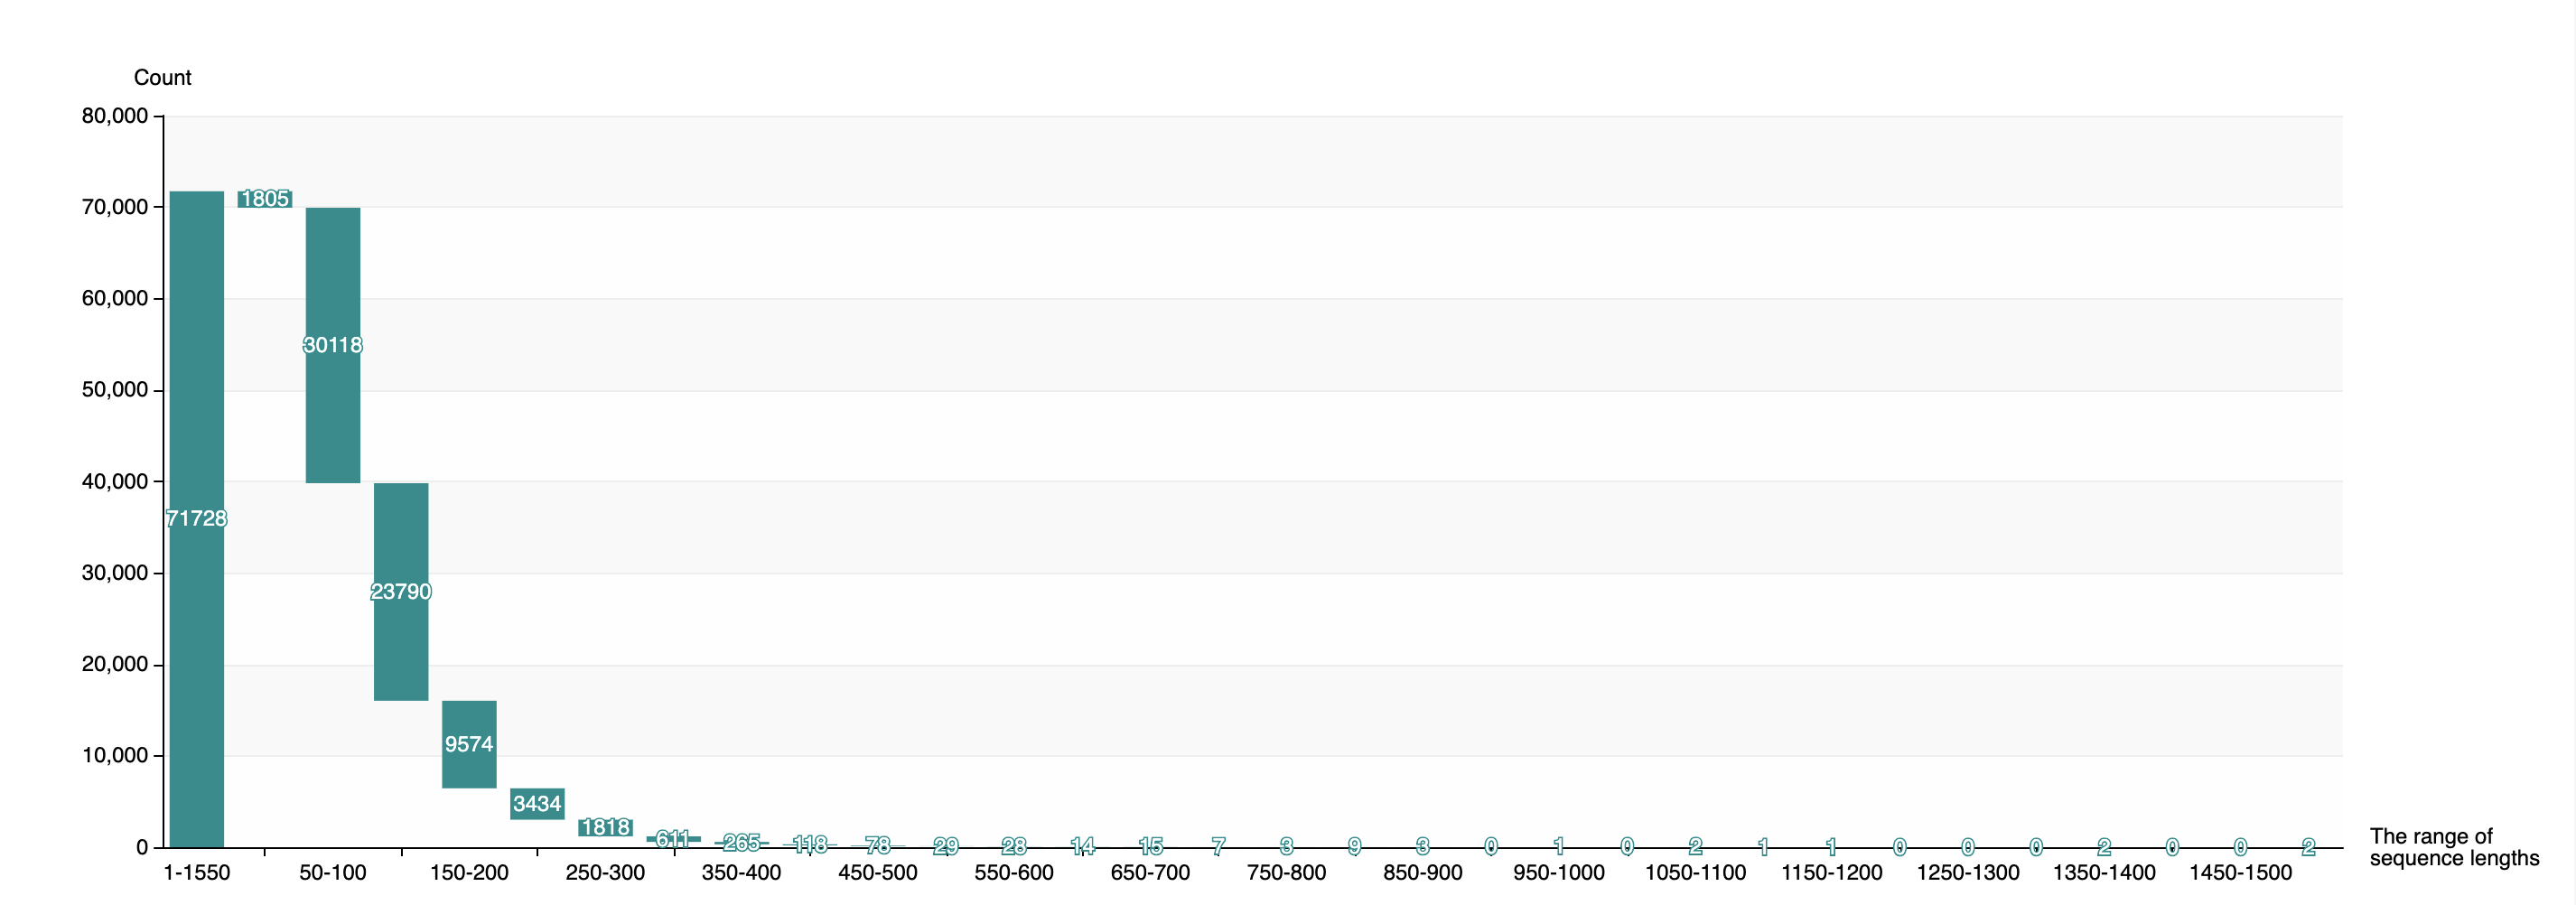
1.3.4 Distribution of sequence lengths of predicted Acrs
-
1.3.5 Distribution of species of experimentally validated Acrs

-
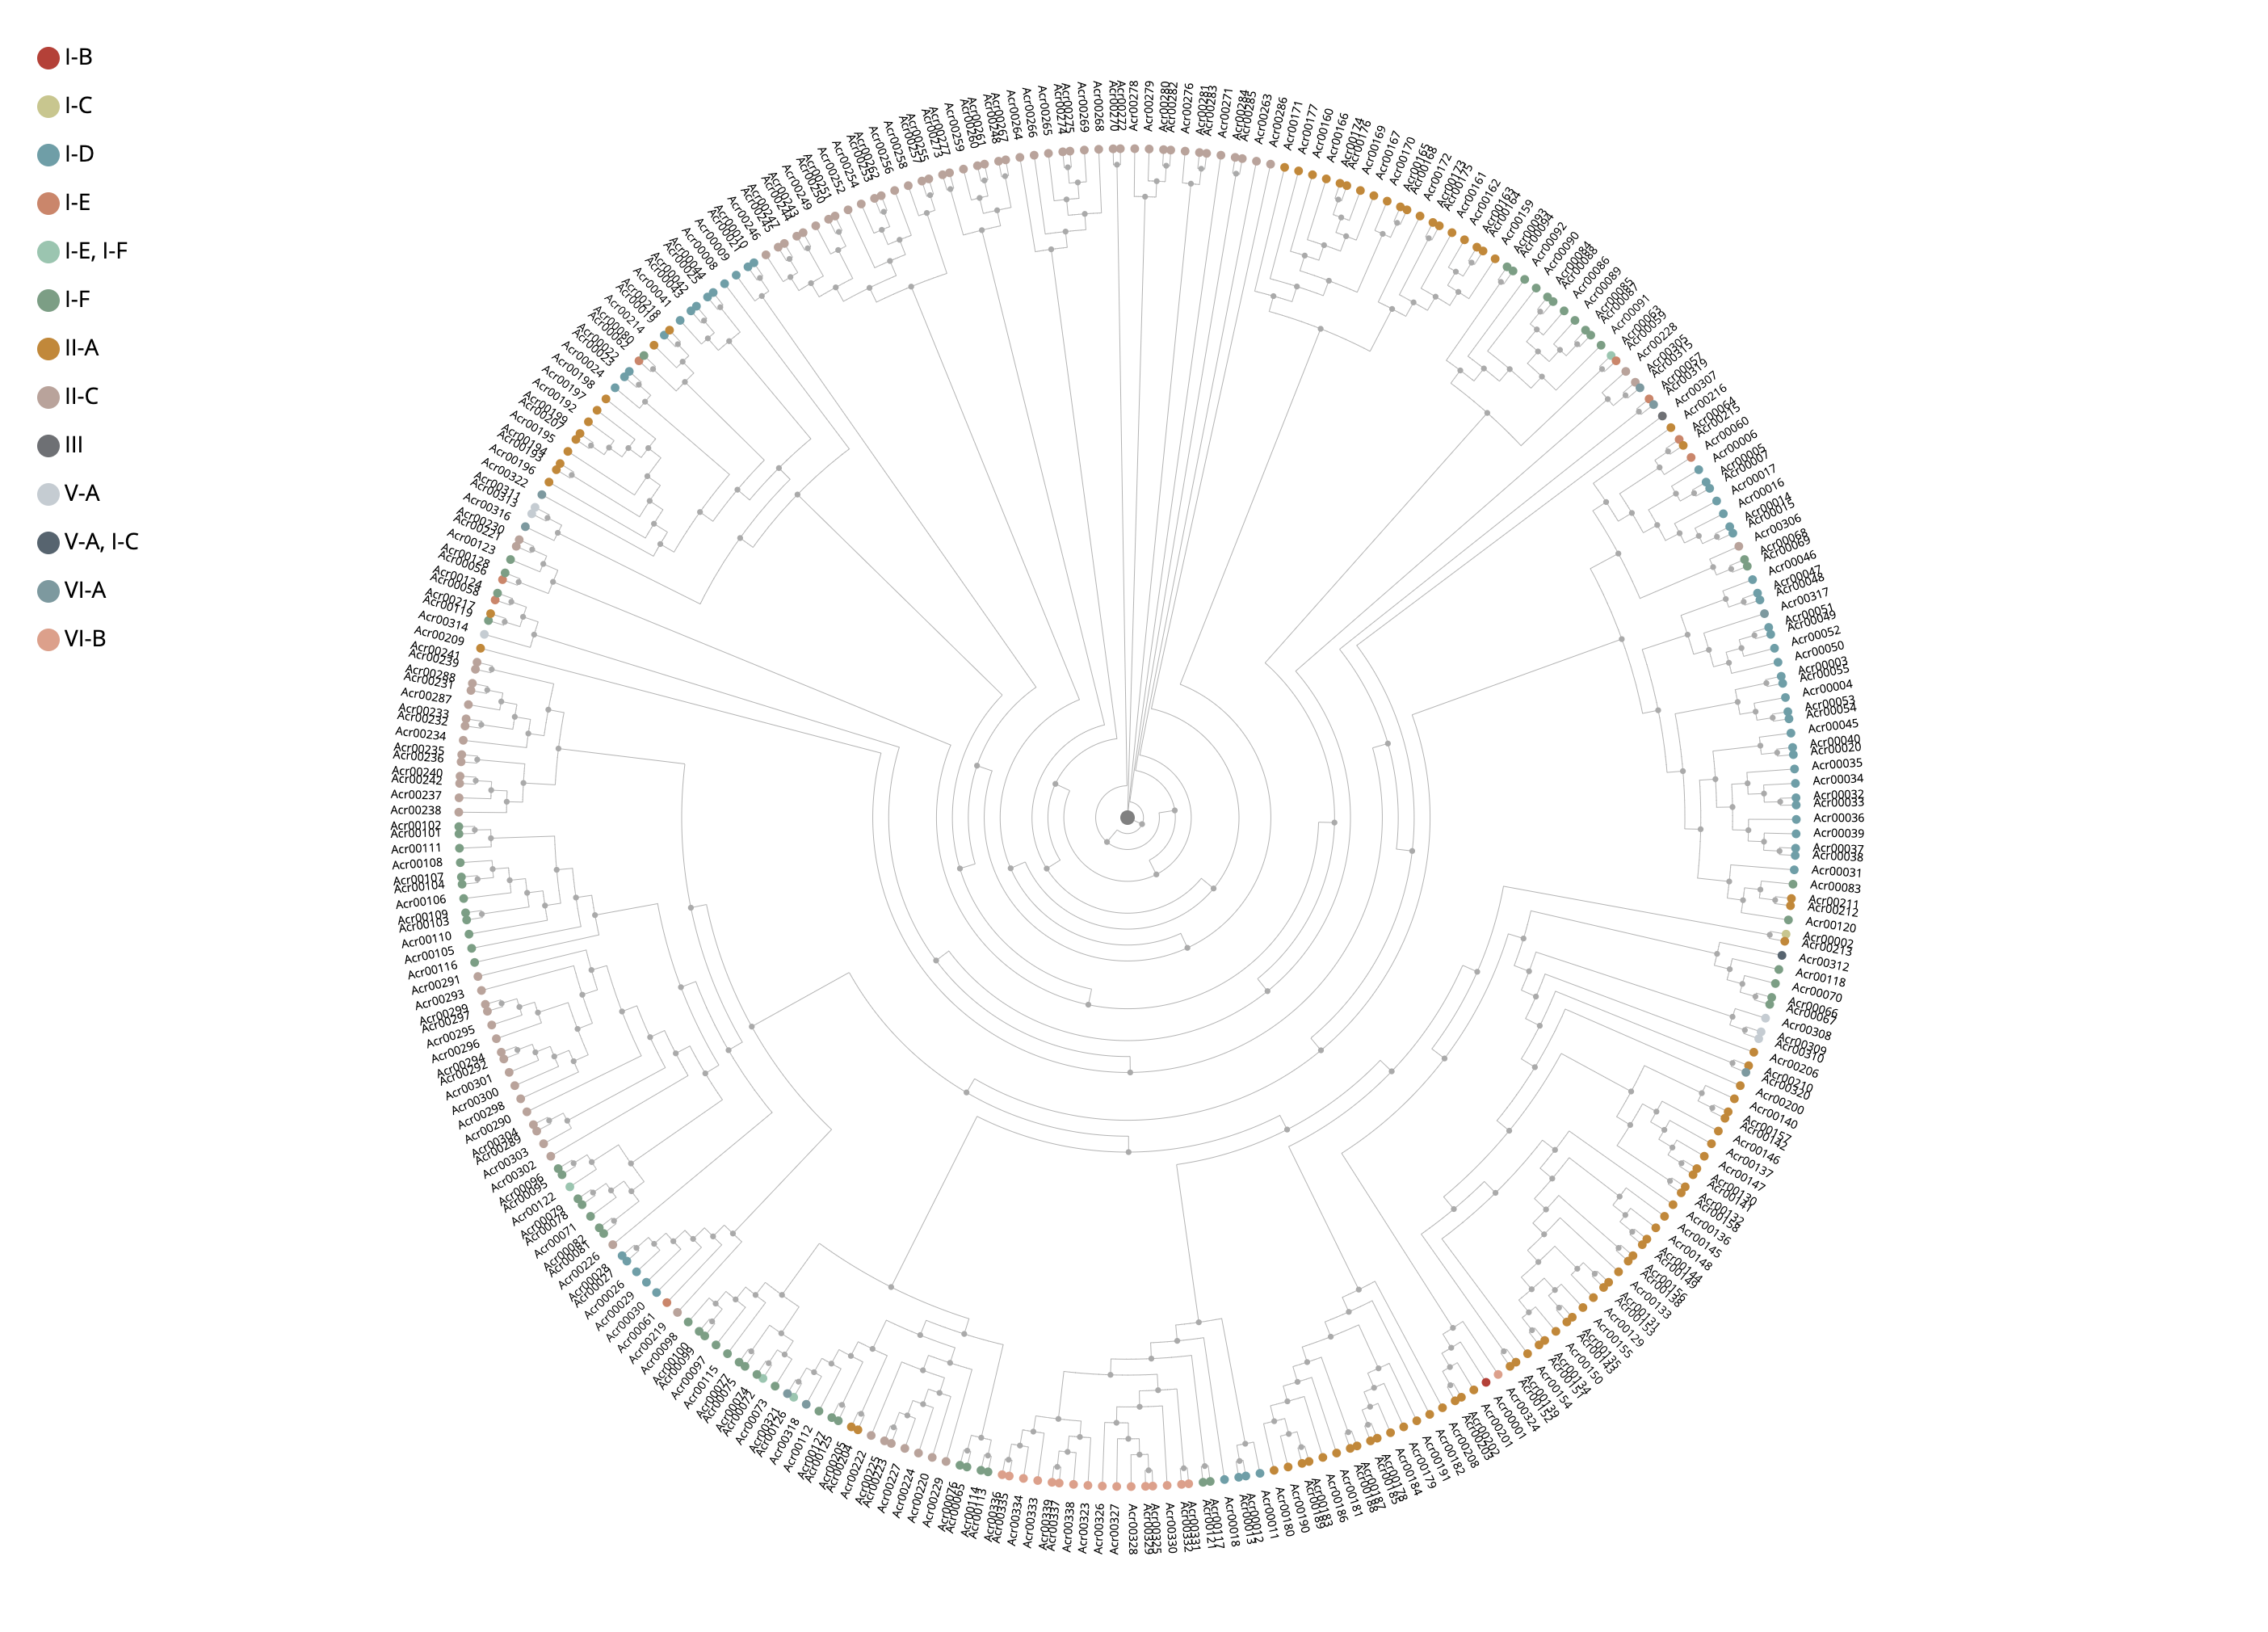
1.3.6 Homology network of experimentally validated Acrs
The all-against-all BLAST (version blast-2.2.26) was used to generate the sequence similarity network among experimentally validated Acrs, which was visualized by ECharts.
-
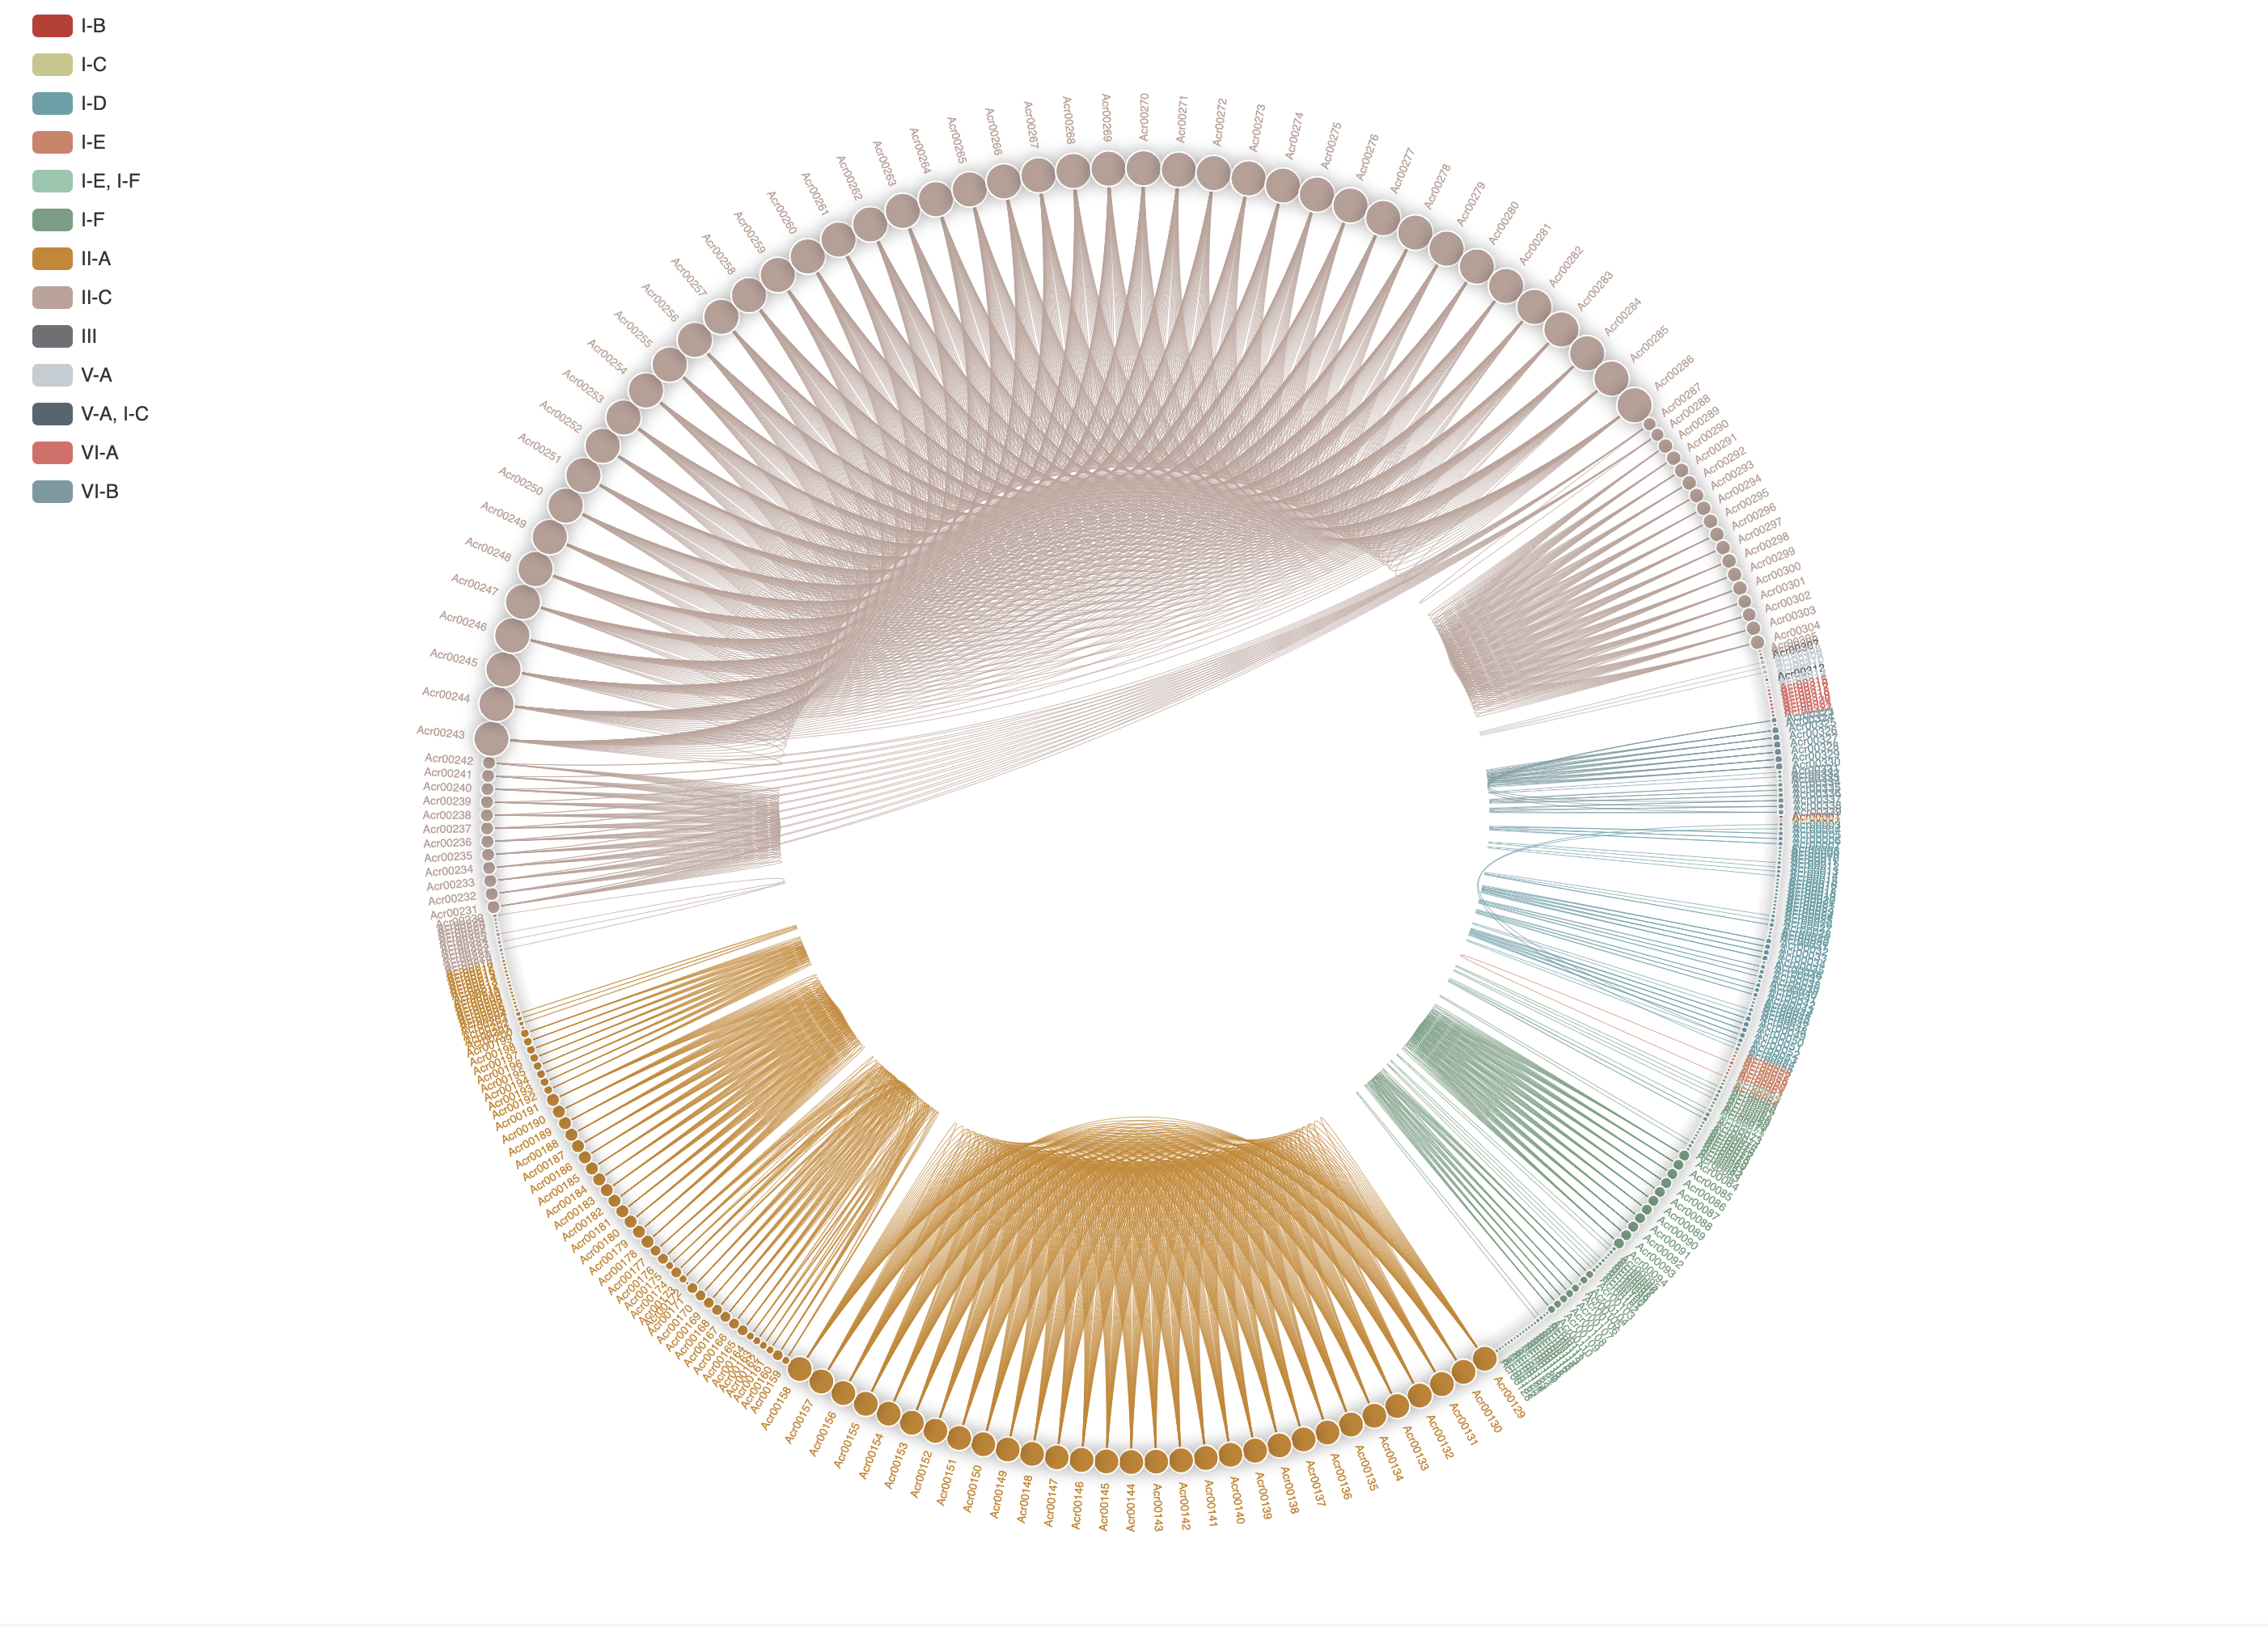
1.3.7 Phylogenetic tree of experimentally validated Acrs
The MAFFT v7.271 was used to generate multiple alignment results among experimentally validated Acrs, which was visualized by the open source phylogram_d3.
1.4 Download
The Download page of AcrHub provides multiple options for users to to download files, including sequences and information of experimentally validated and predicted Acrs, and secondary structures, disorder files and multiple alignments of experimentally validated Acrs.

1.5 Detailed information
The Detailed information page of AcrHub provides validated or predicted functions and attributes for experimentally validated and predicted Acrs, including basic information, protein structure, secondary structure, disorder area, similarity analysis, multiple sequence alignments, phylogenetic analysis and homology network.
-
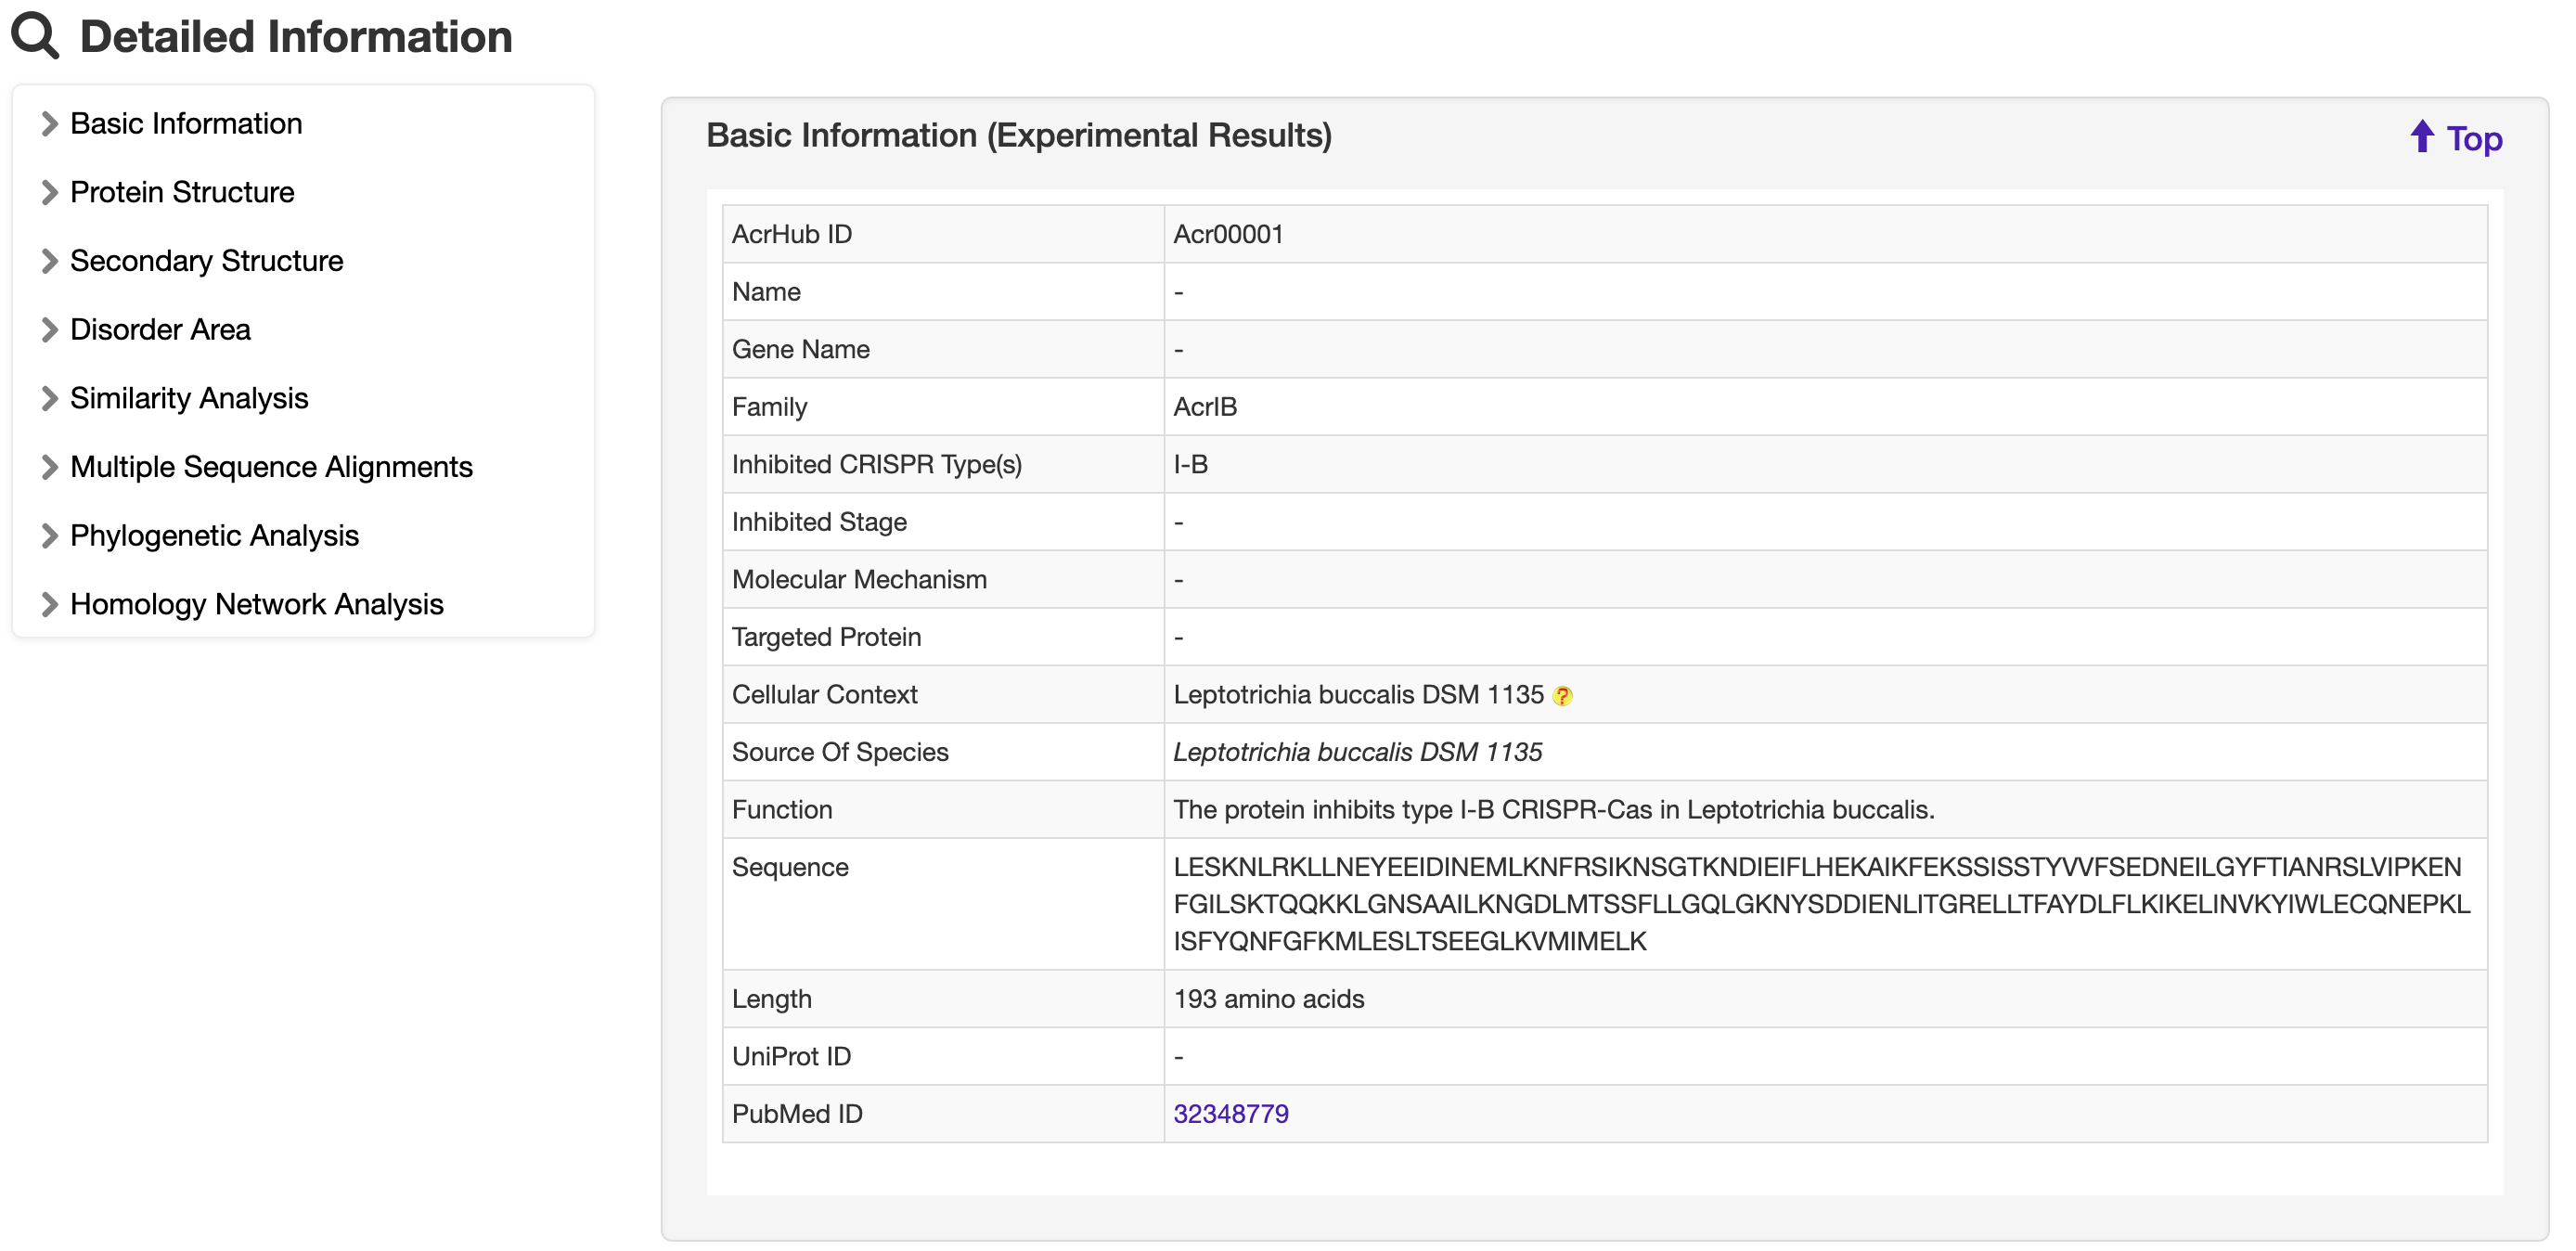
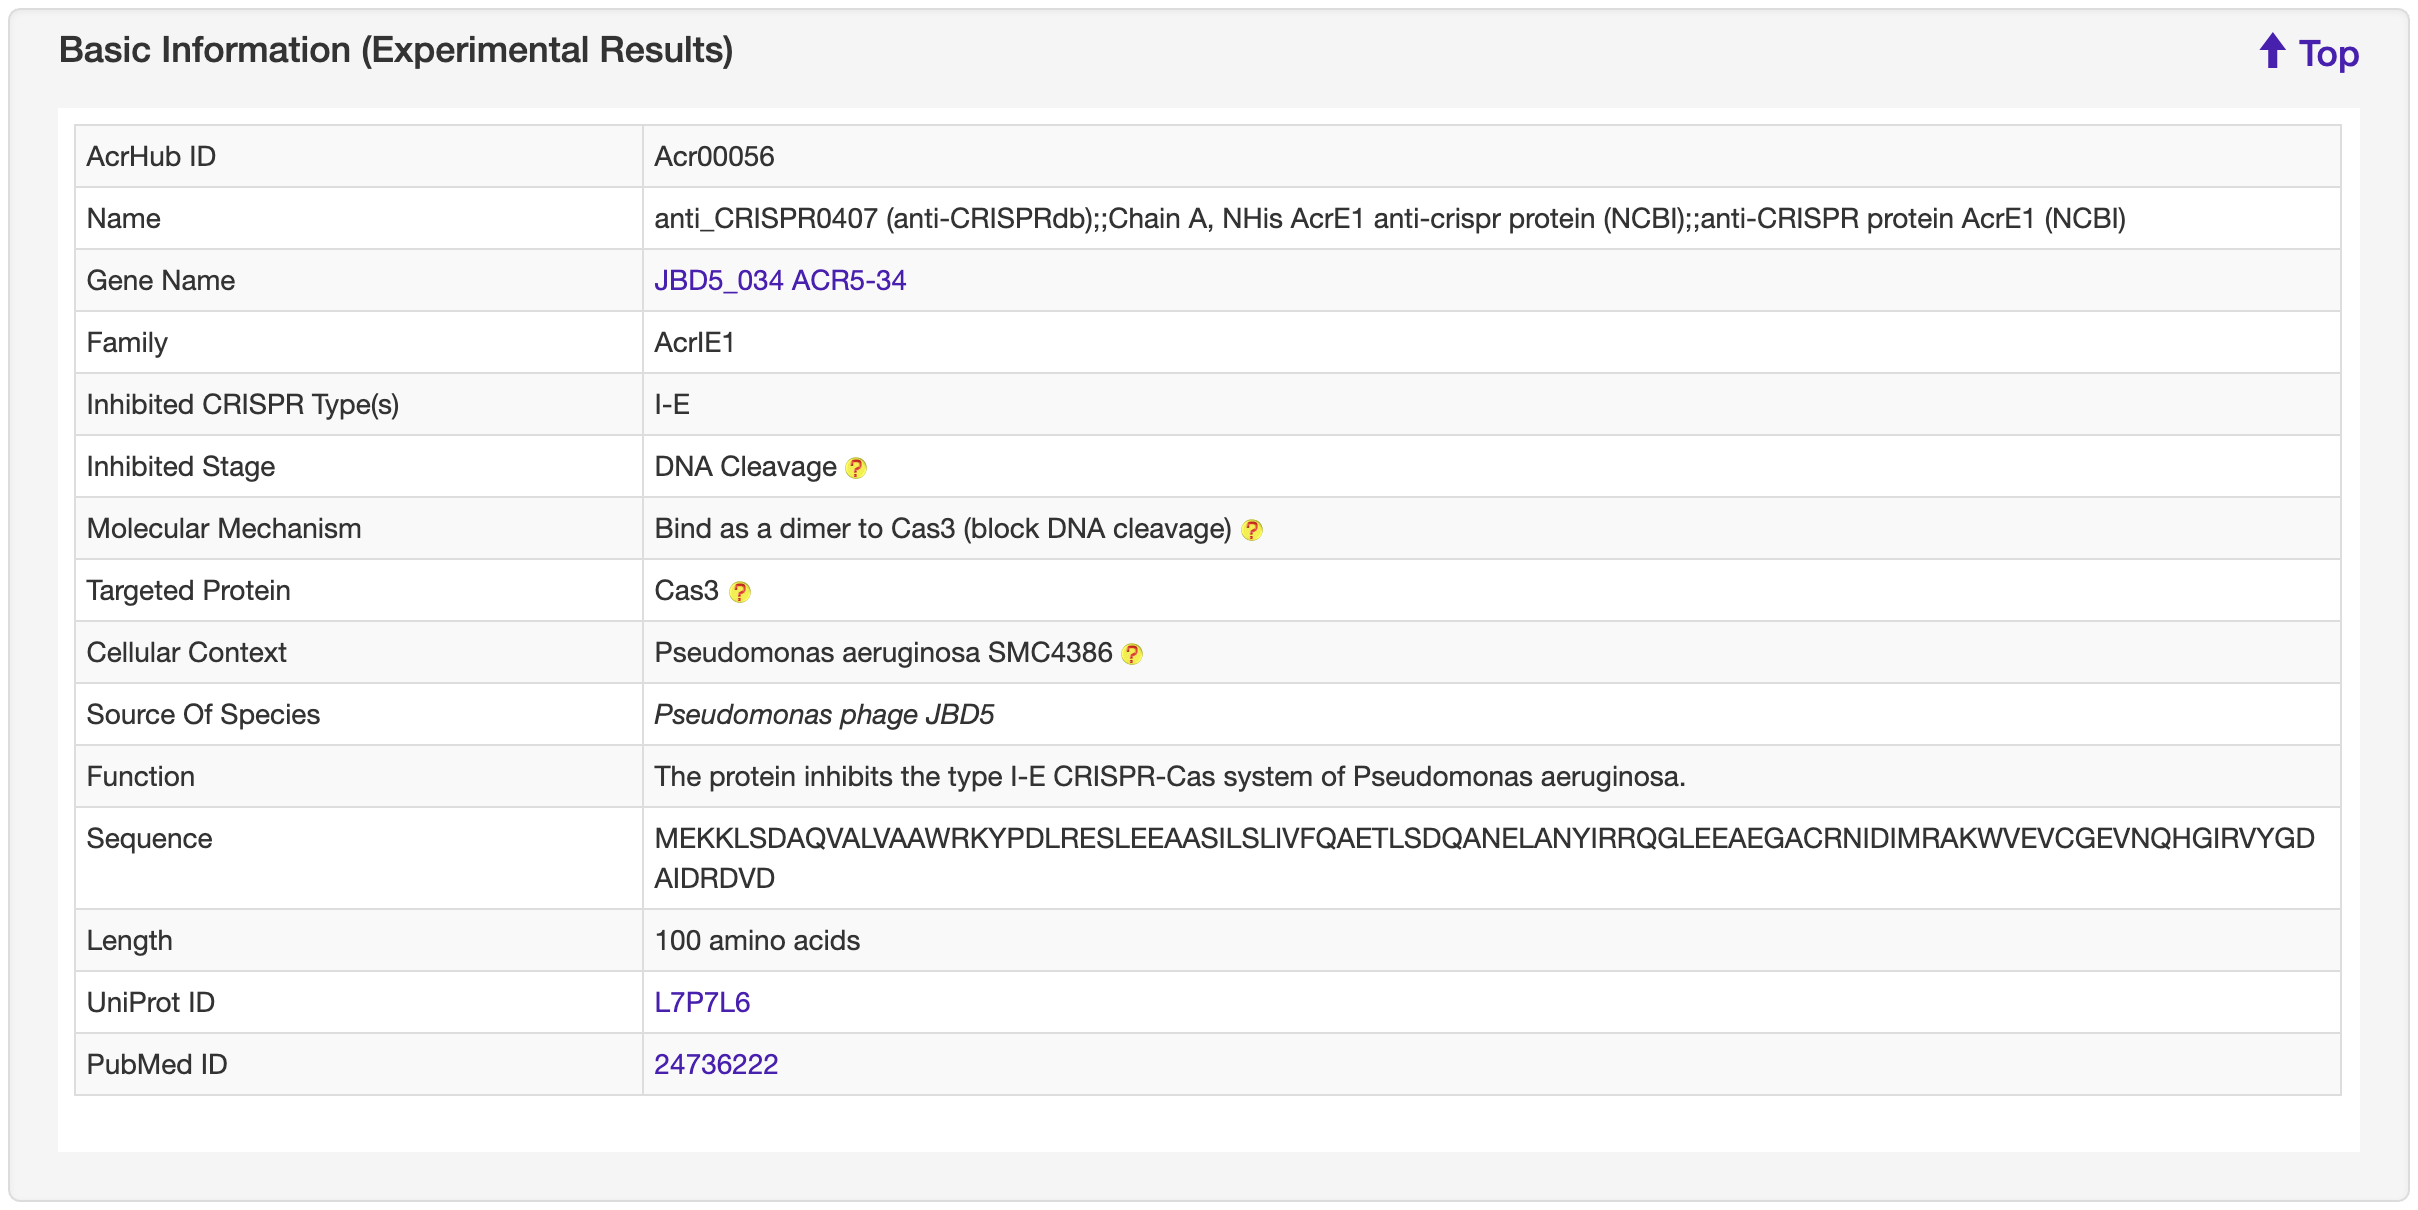
1.5.1 Basic Information
-
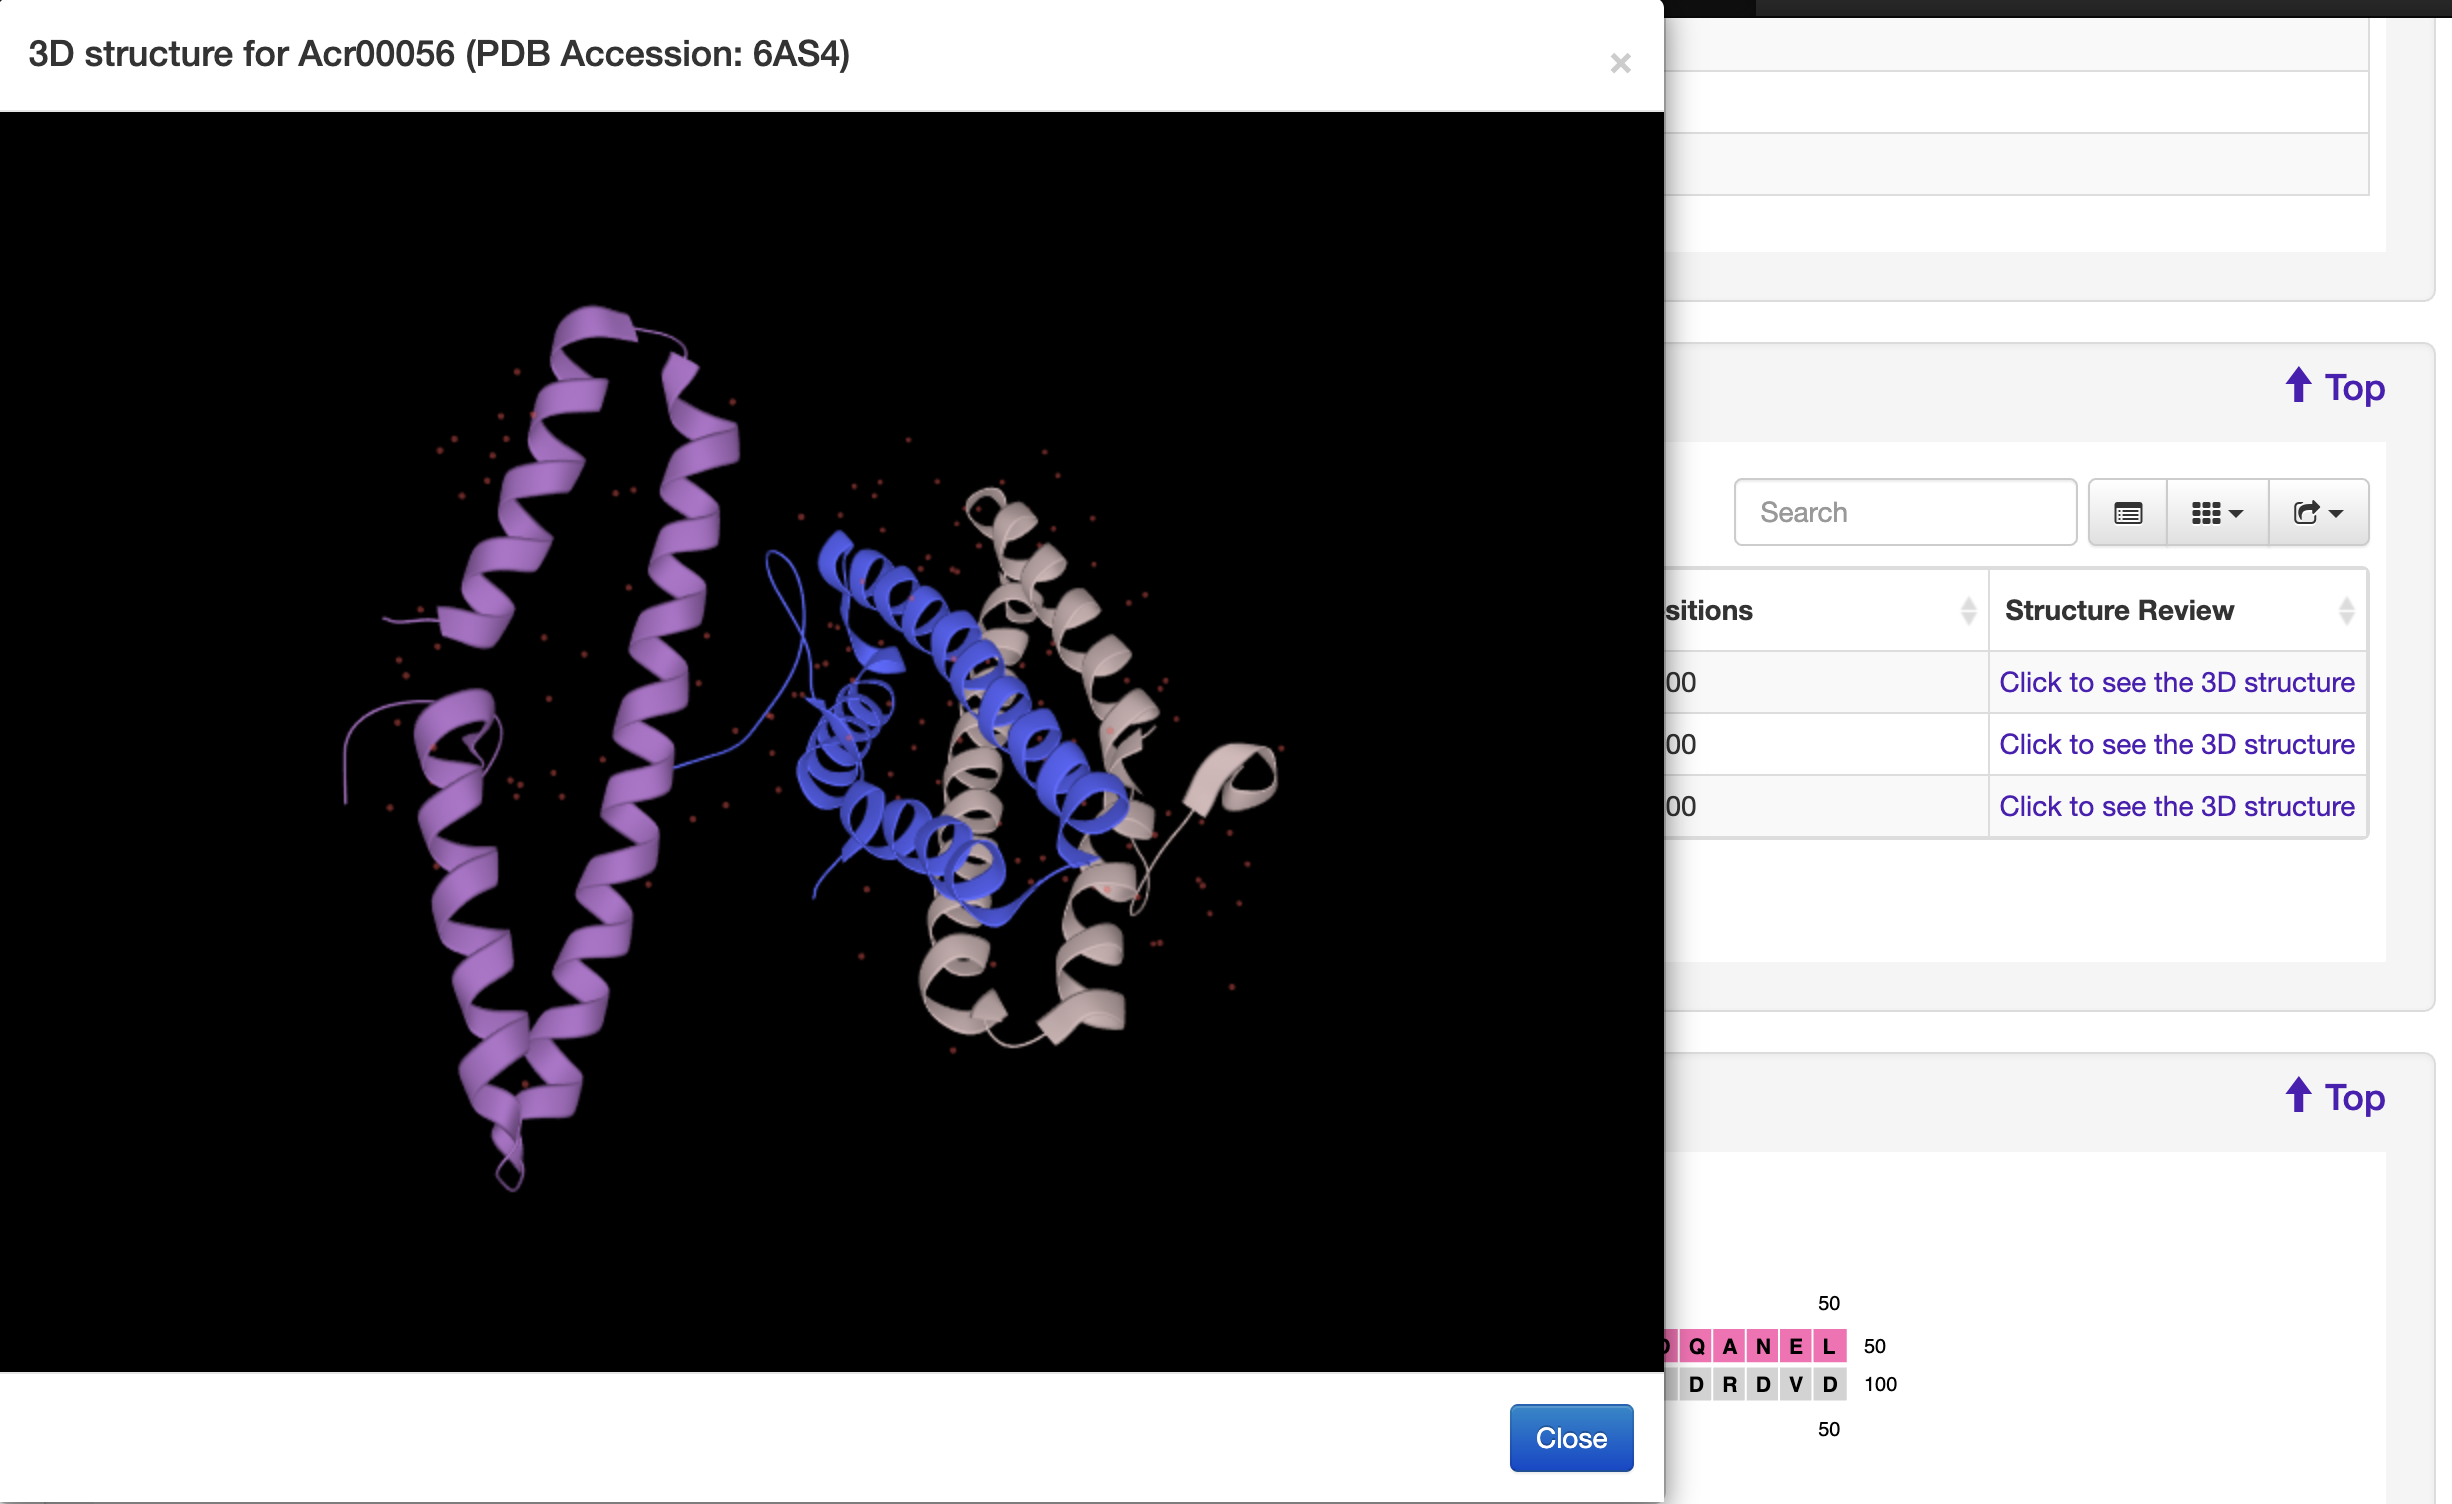
1.5.2 Protein Structure
For each entry, the protein structure information was collected from the PDB database where available. A 3-D visualization was provided by using PDB LiteMol. Following is an example for Acr00056

-
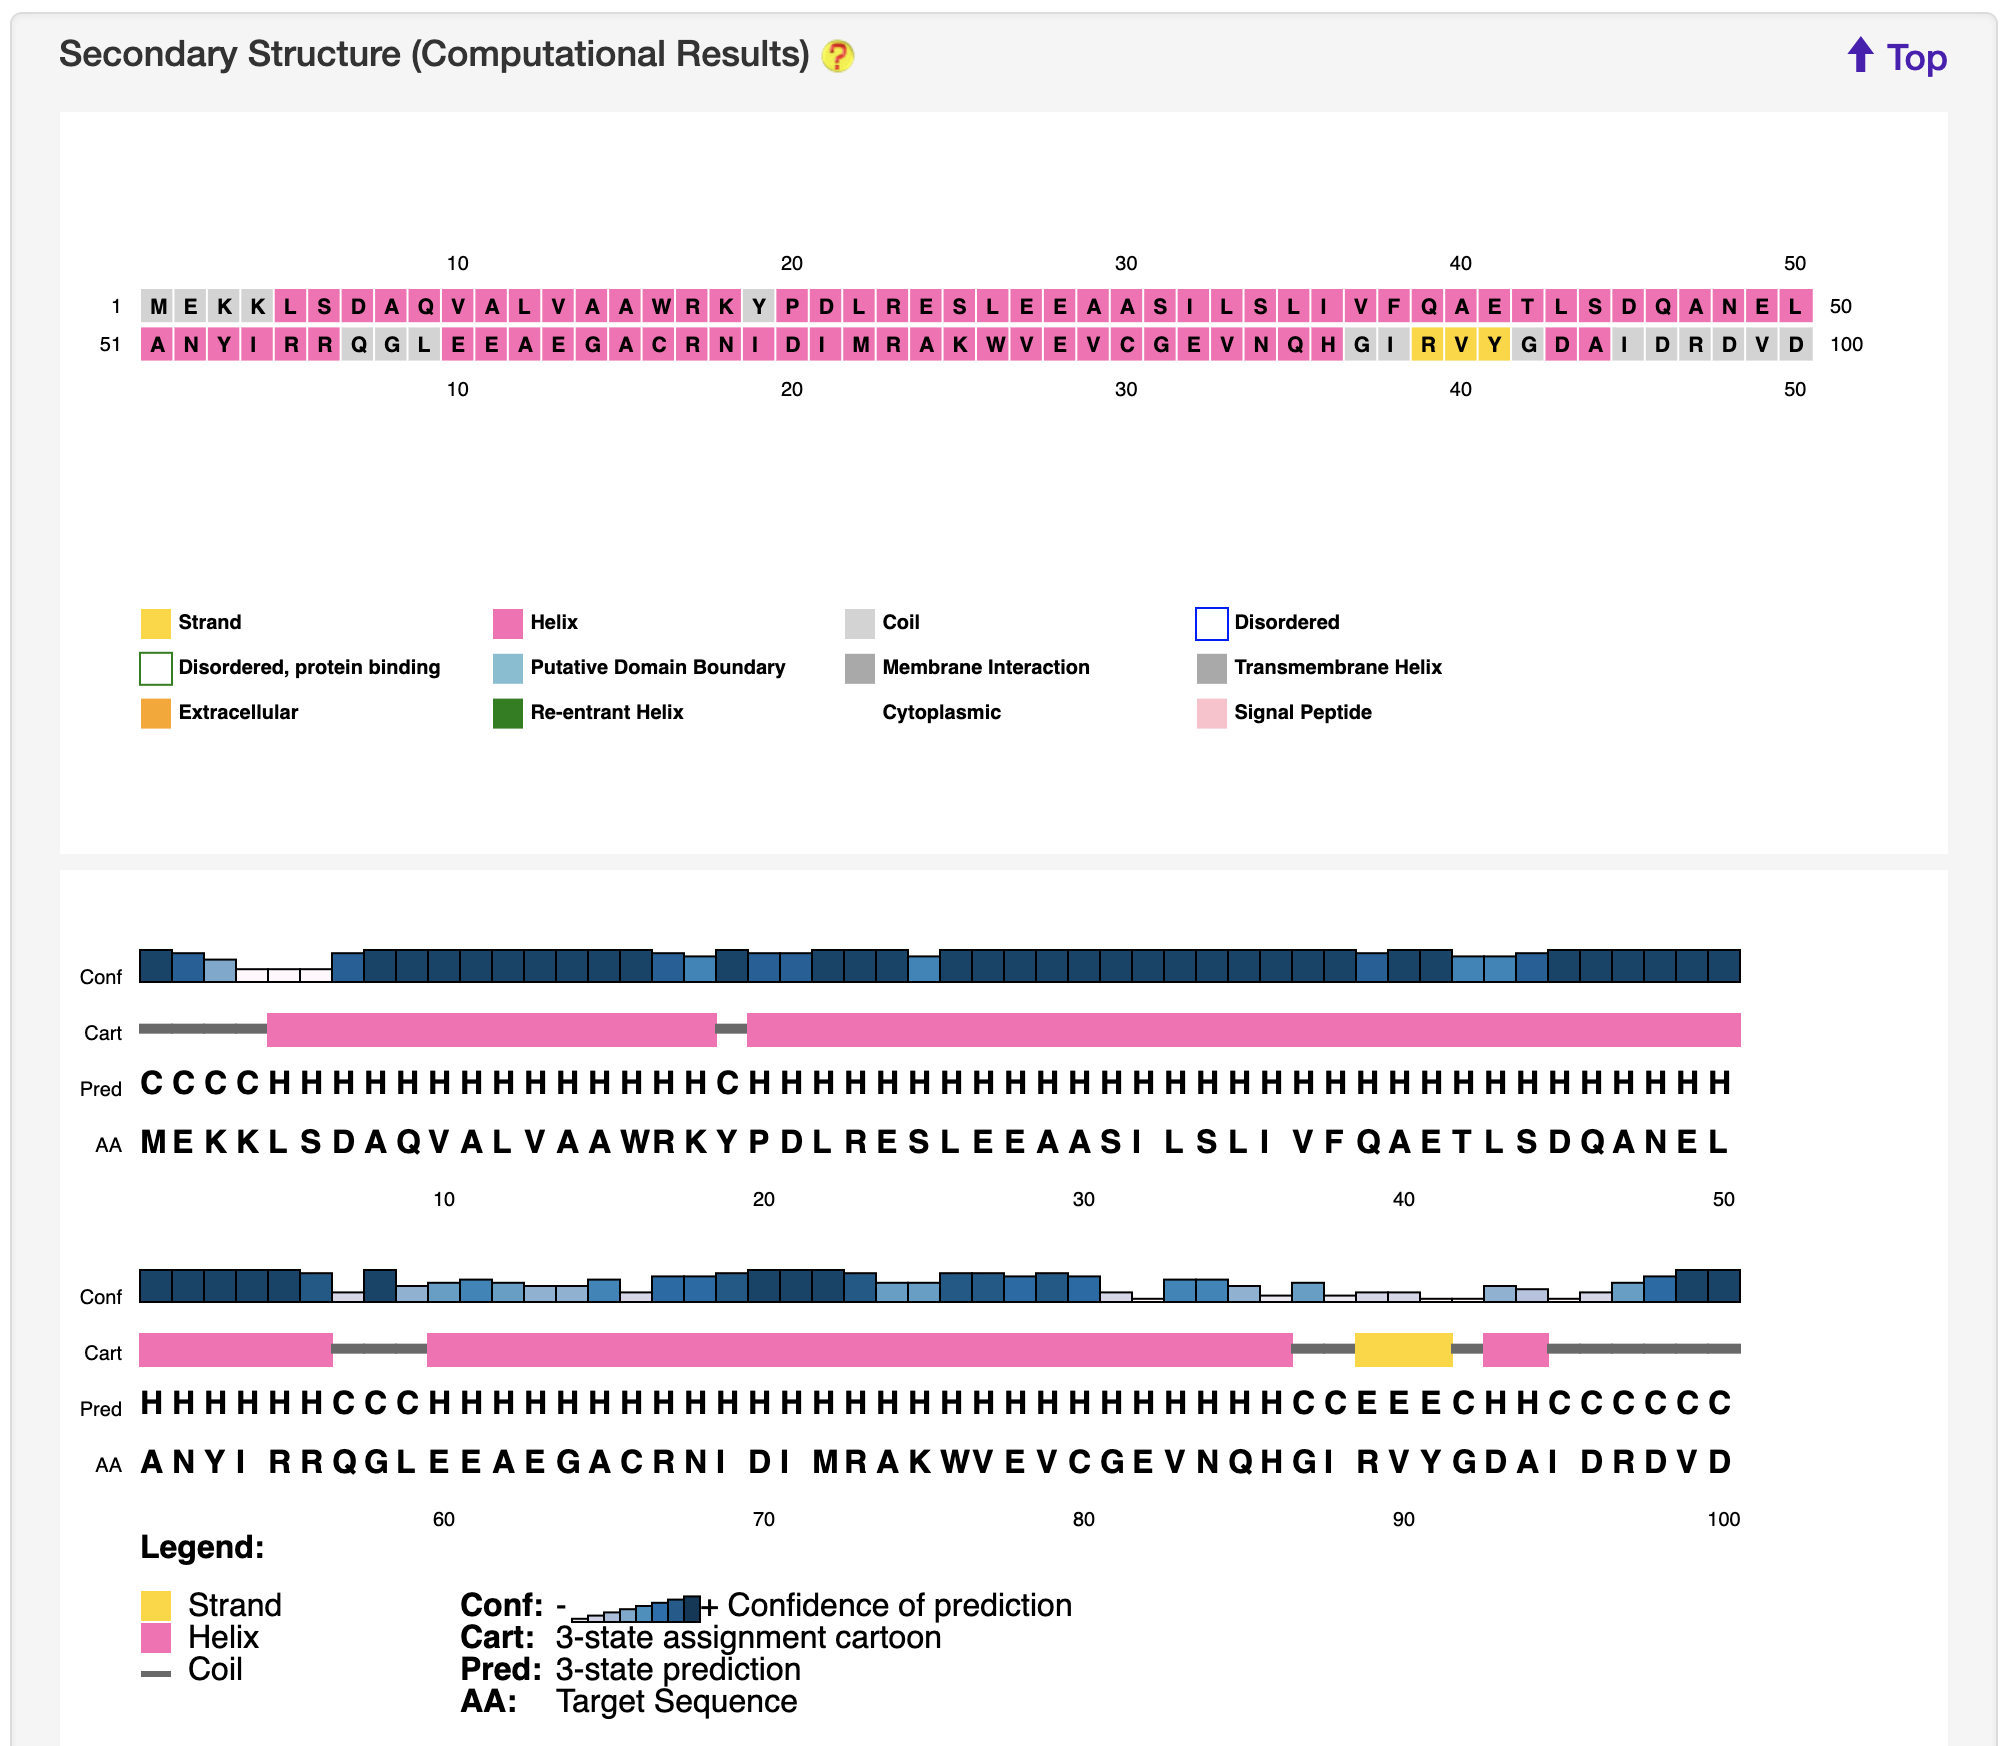
1.5.3 Secondary Structure
For each entry, the secondary structure was predicted and visualized by PSIPRED 4.0 server.
-
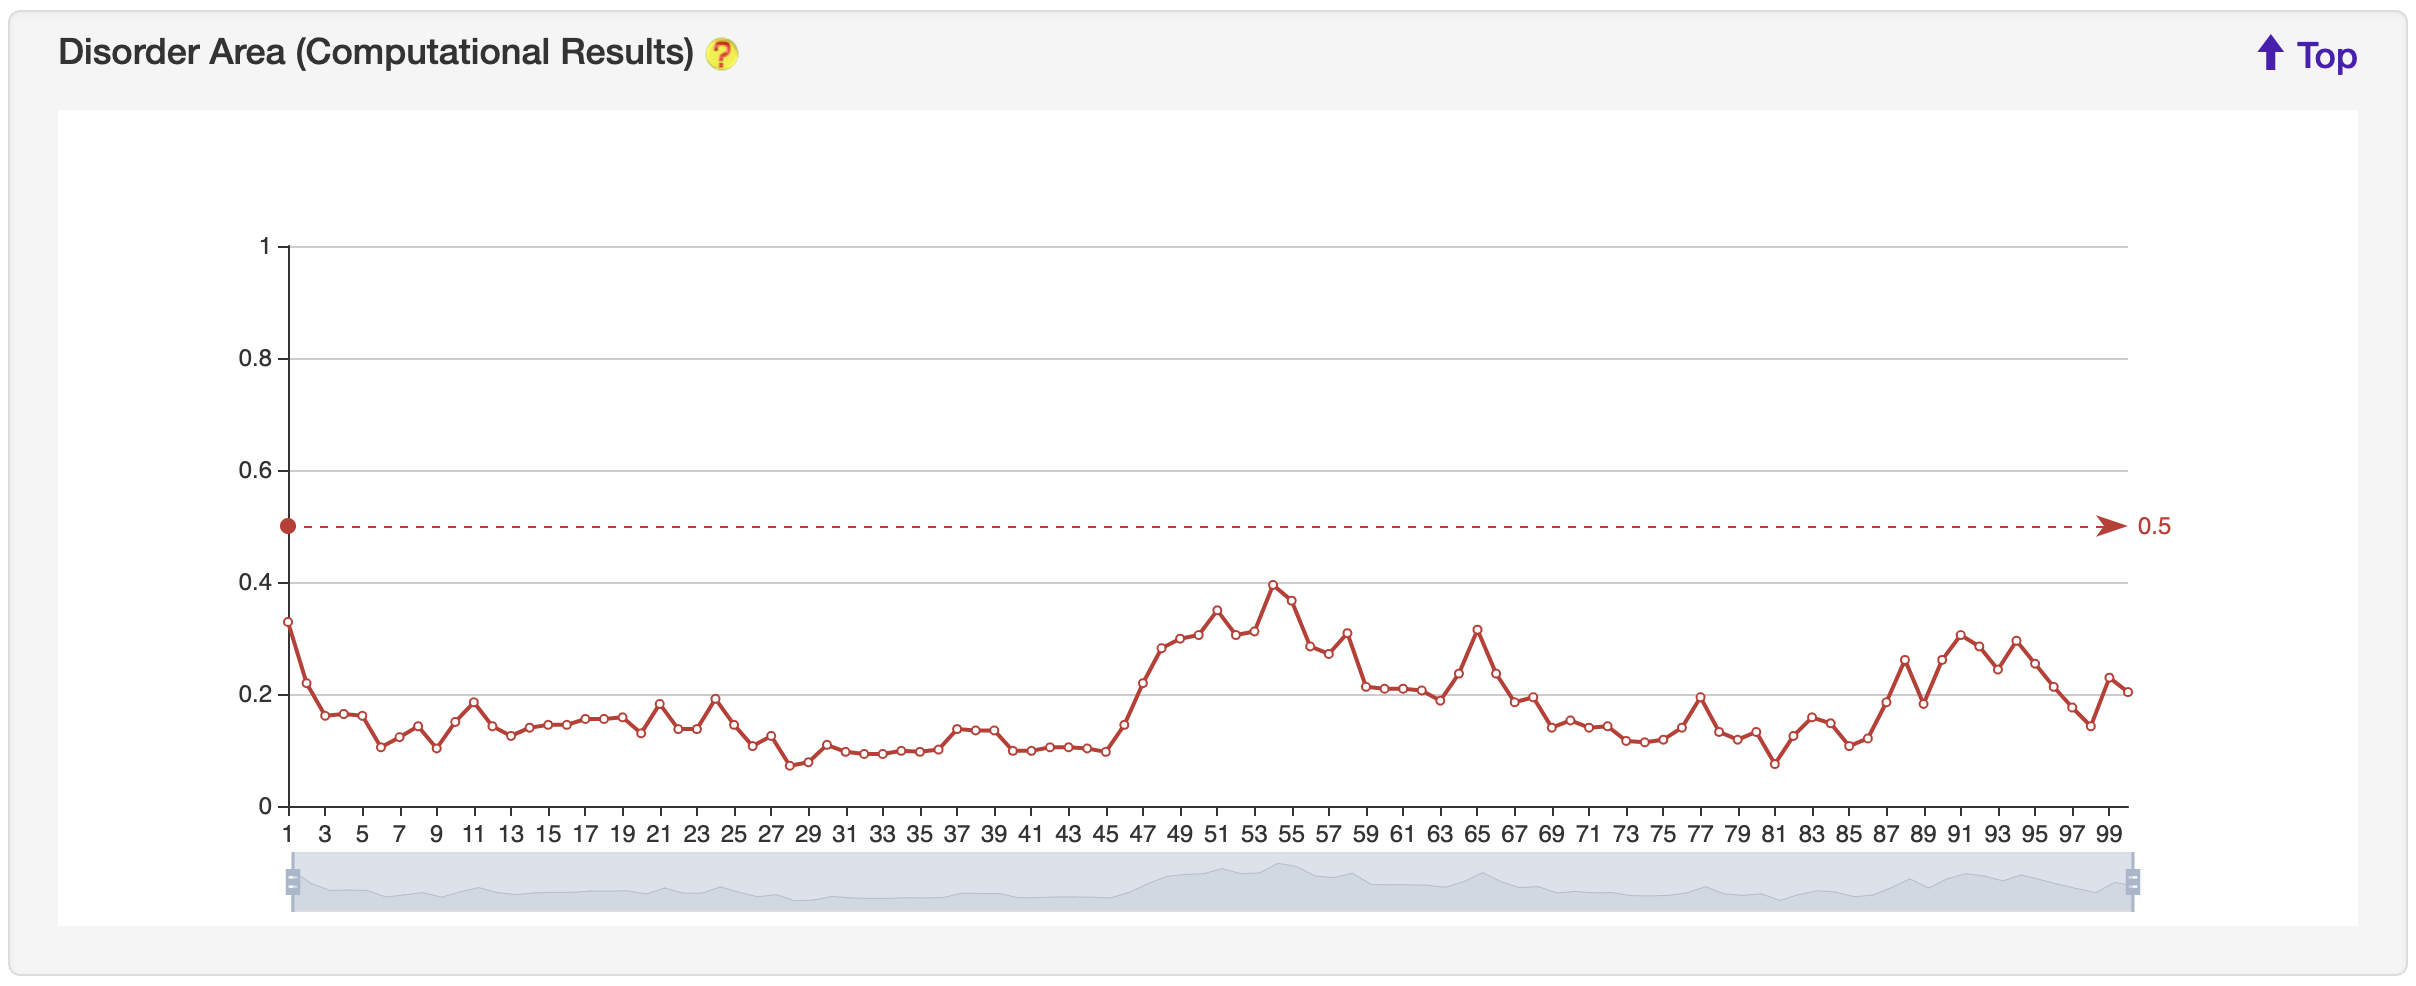
1.5.4 Disorder Area
For each entry, the disorder area was generated by the IUPred2A server, and visualized by ECharts.
-
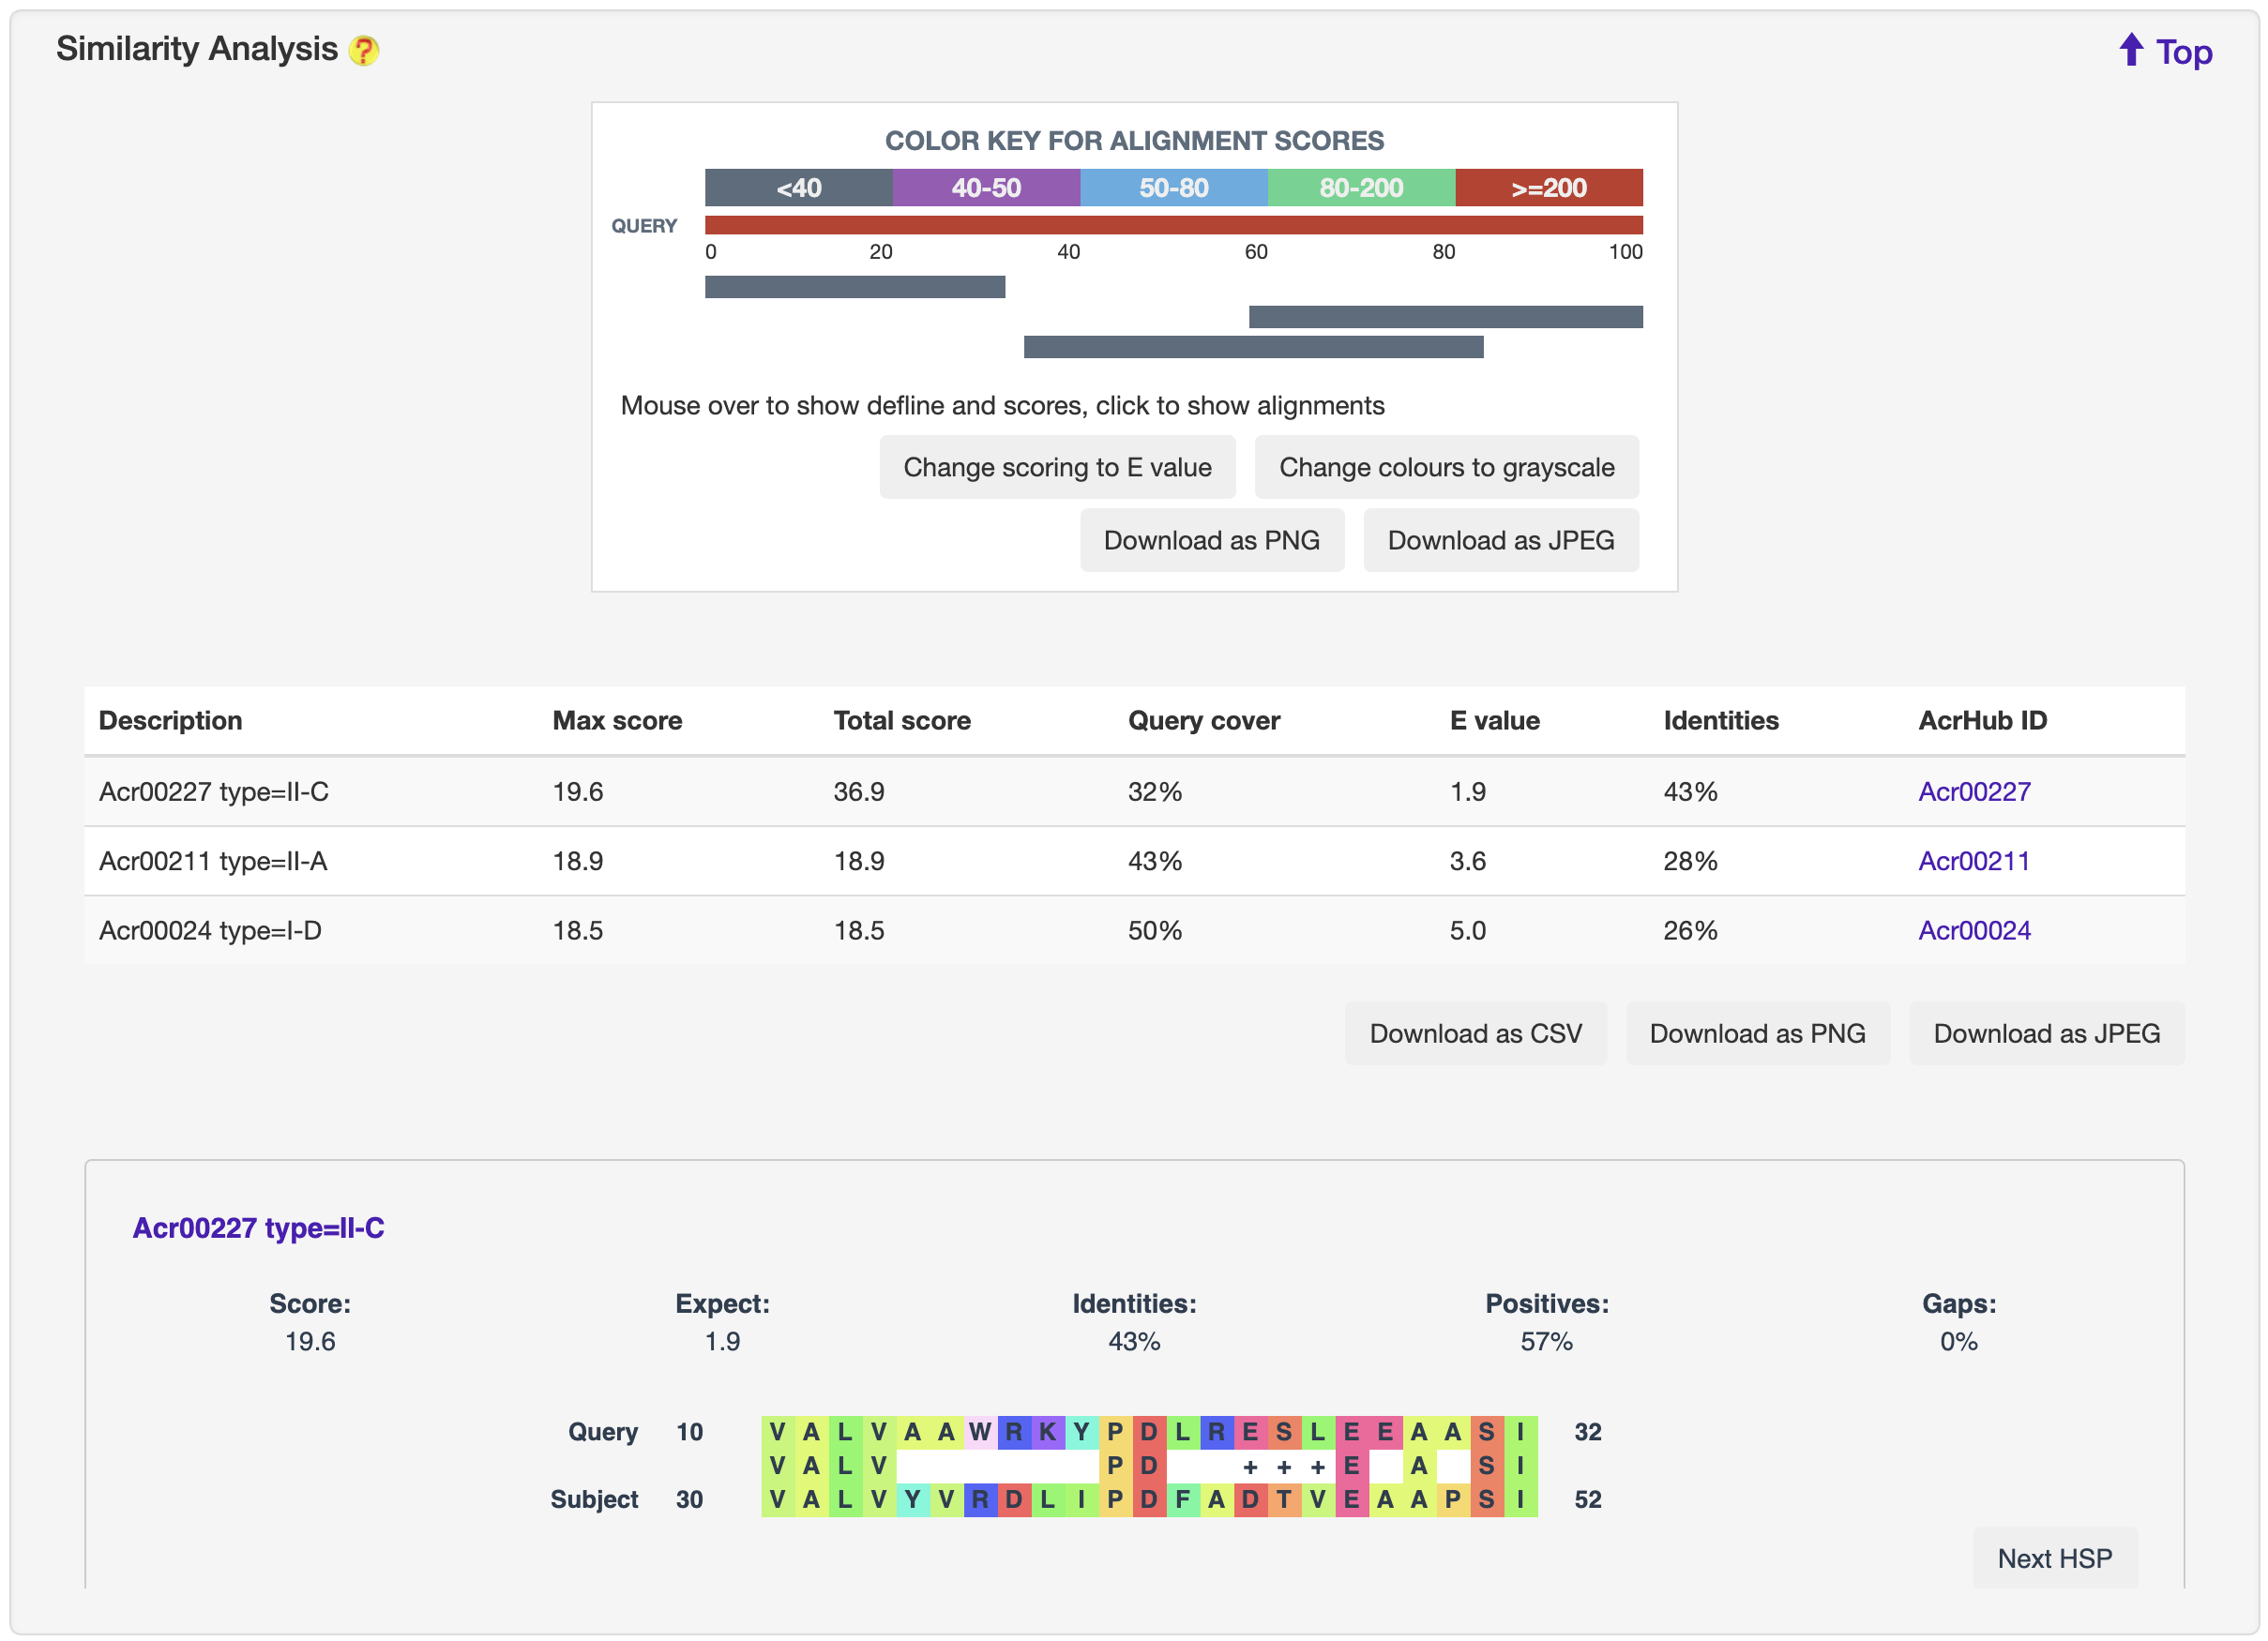
1.5.5 Similarity Analysis
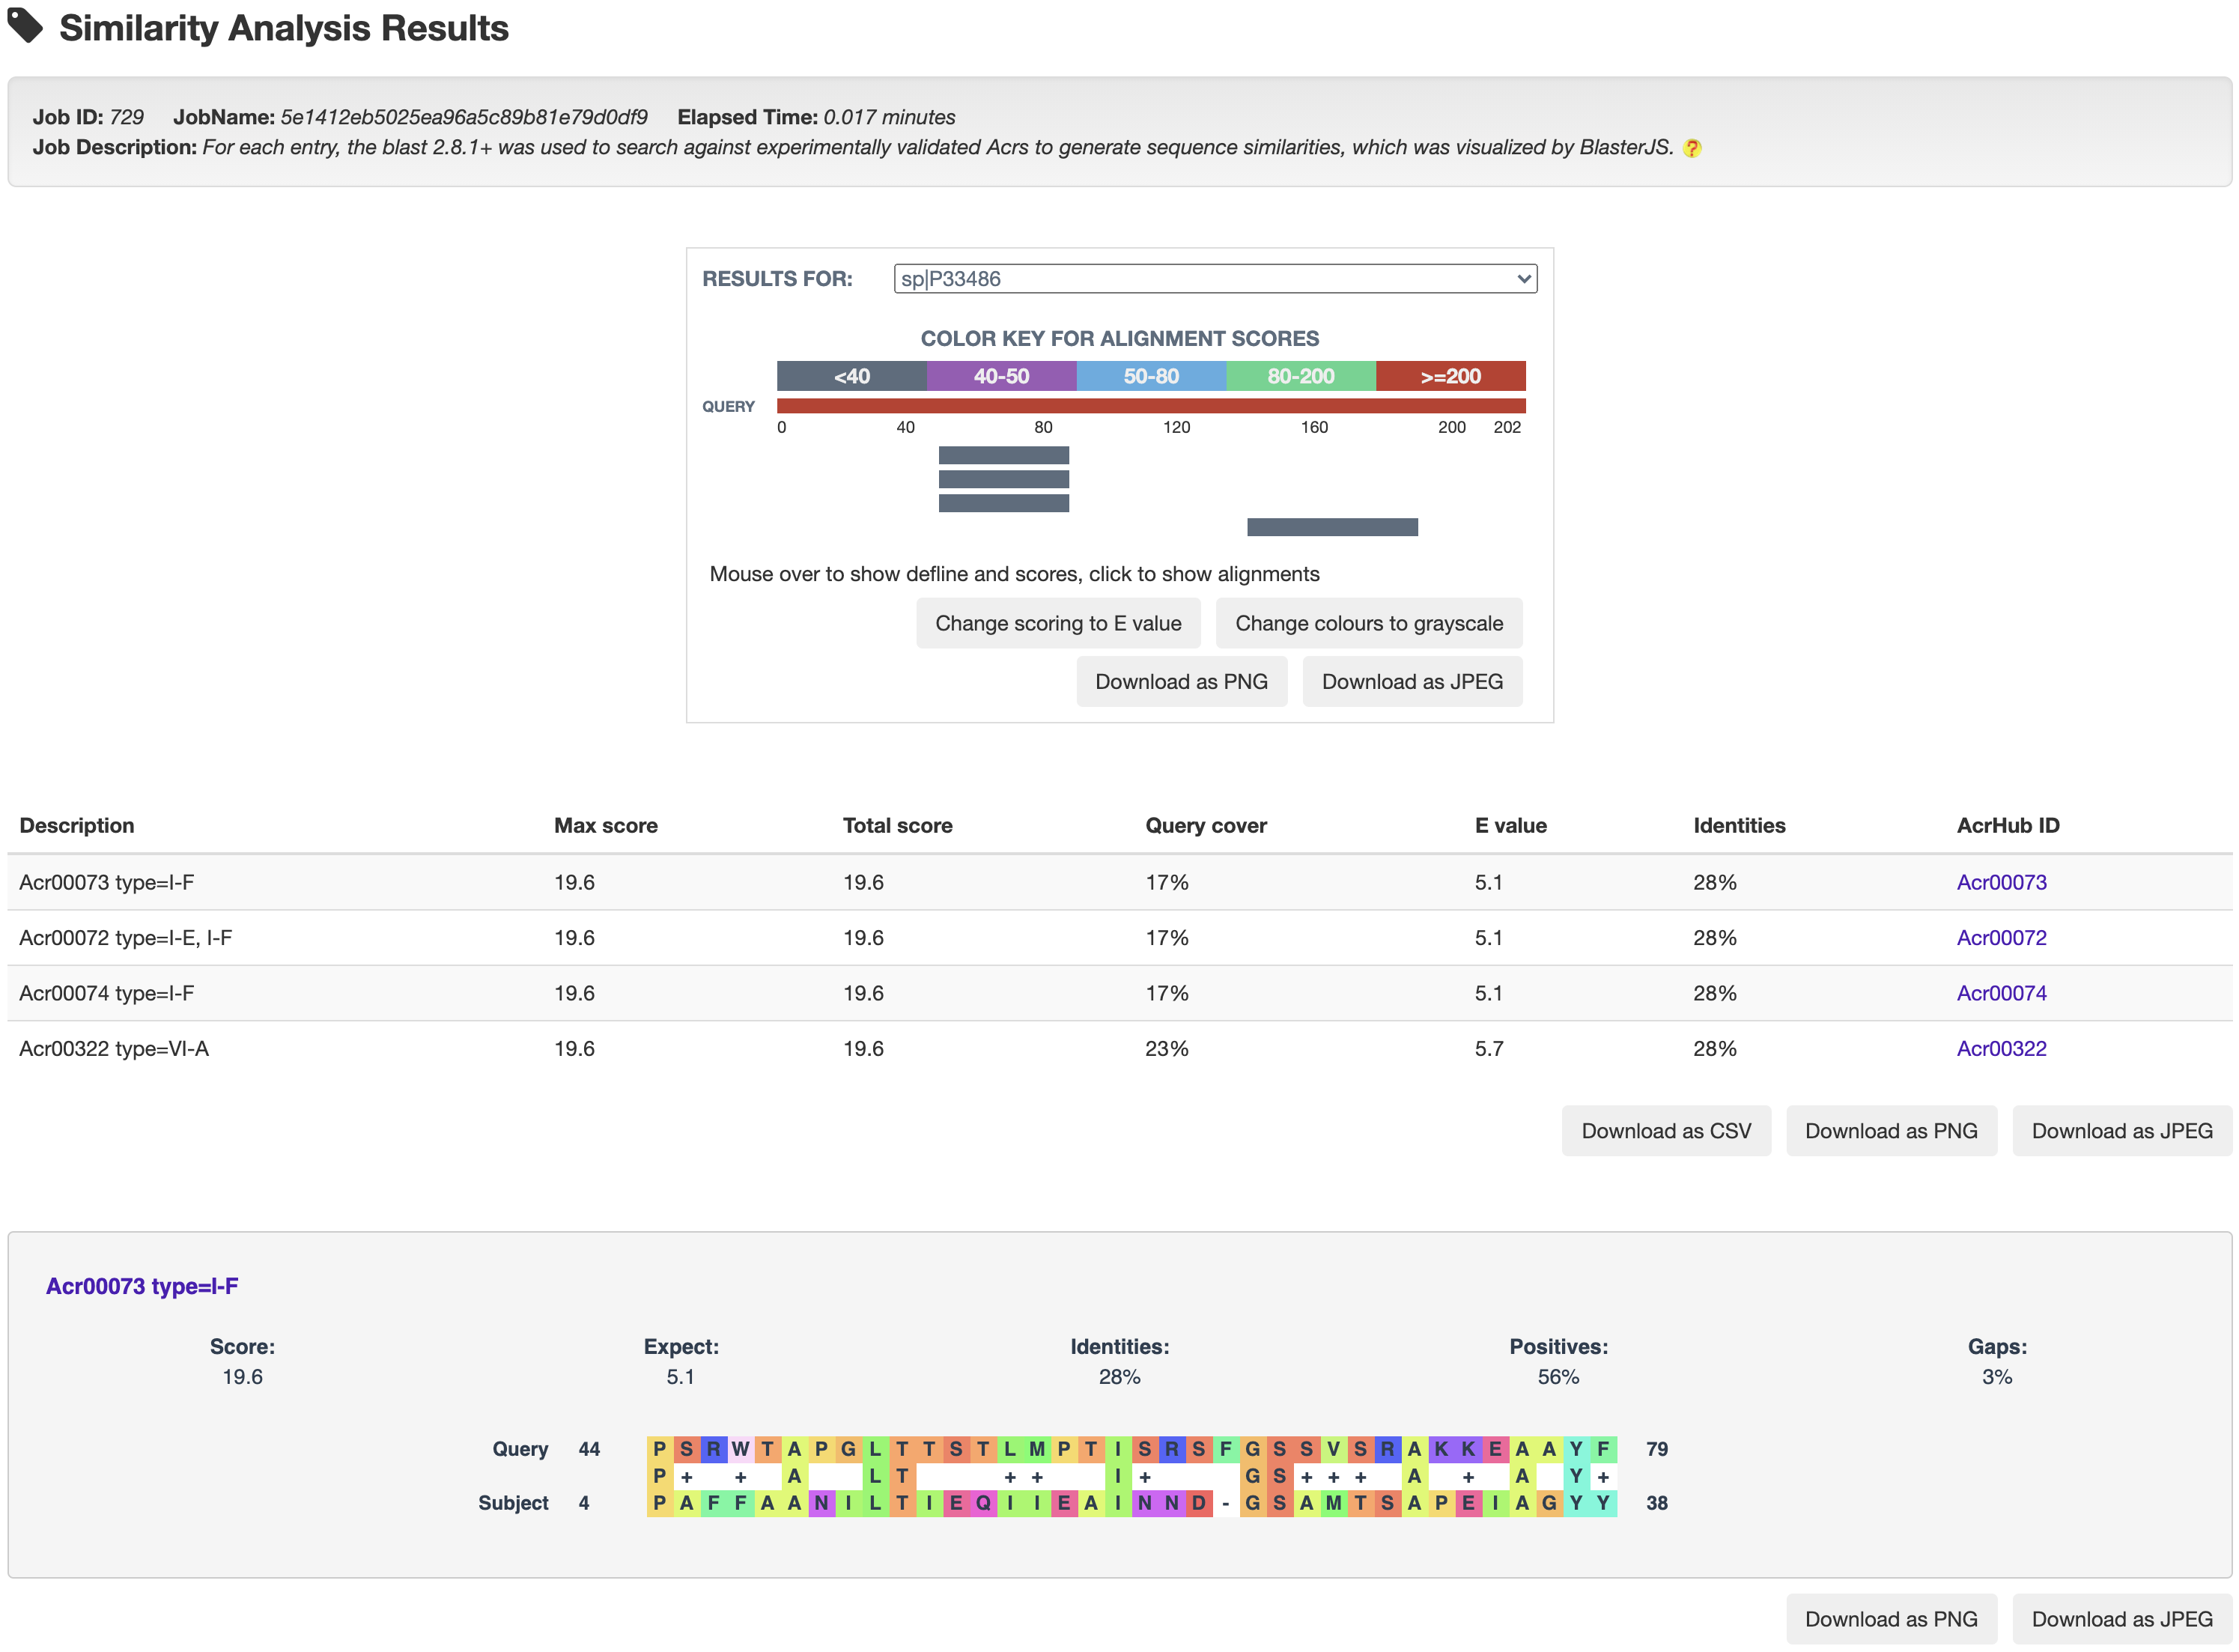
For each entry, the blast 2.8.1+ was used to search against experimentally validated Acrs to generate sequence similarities, which was visualized by BlasterJS.
-
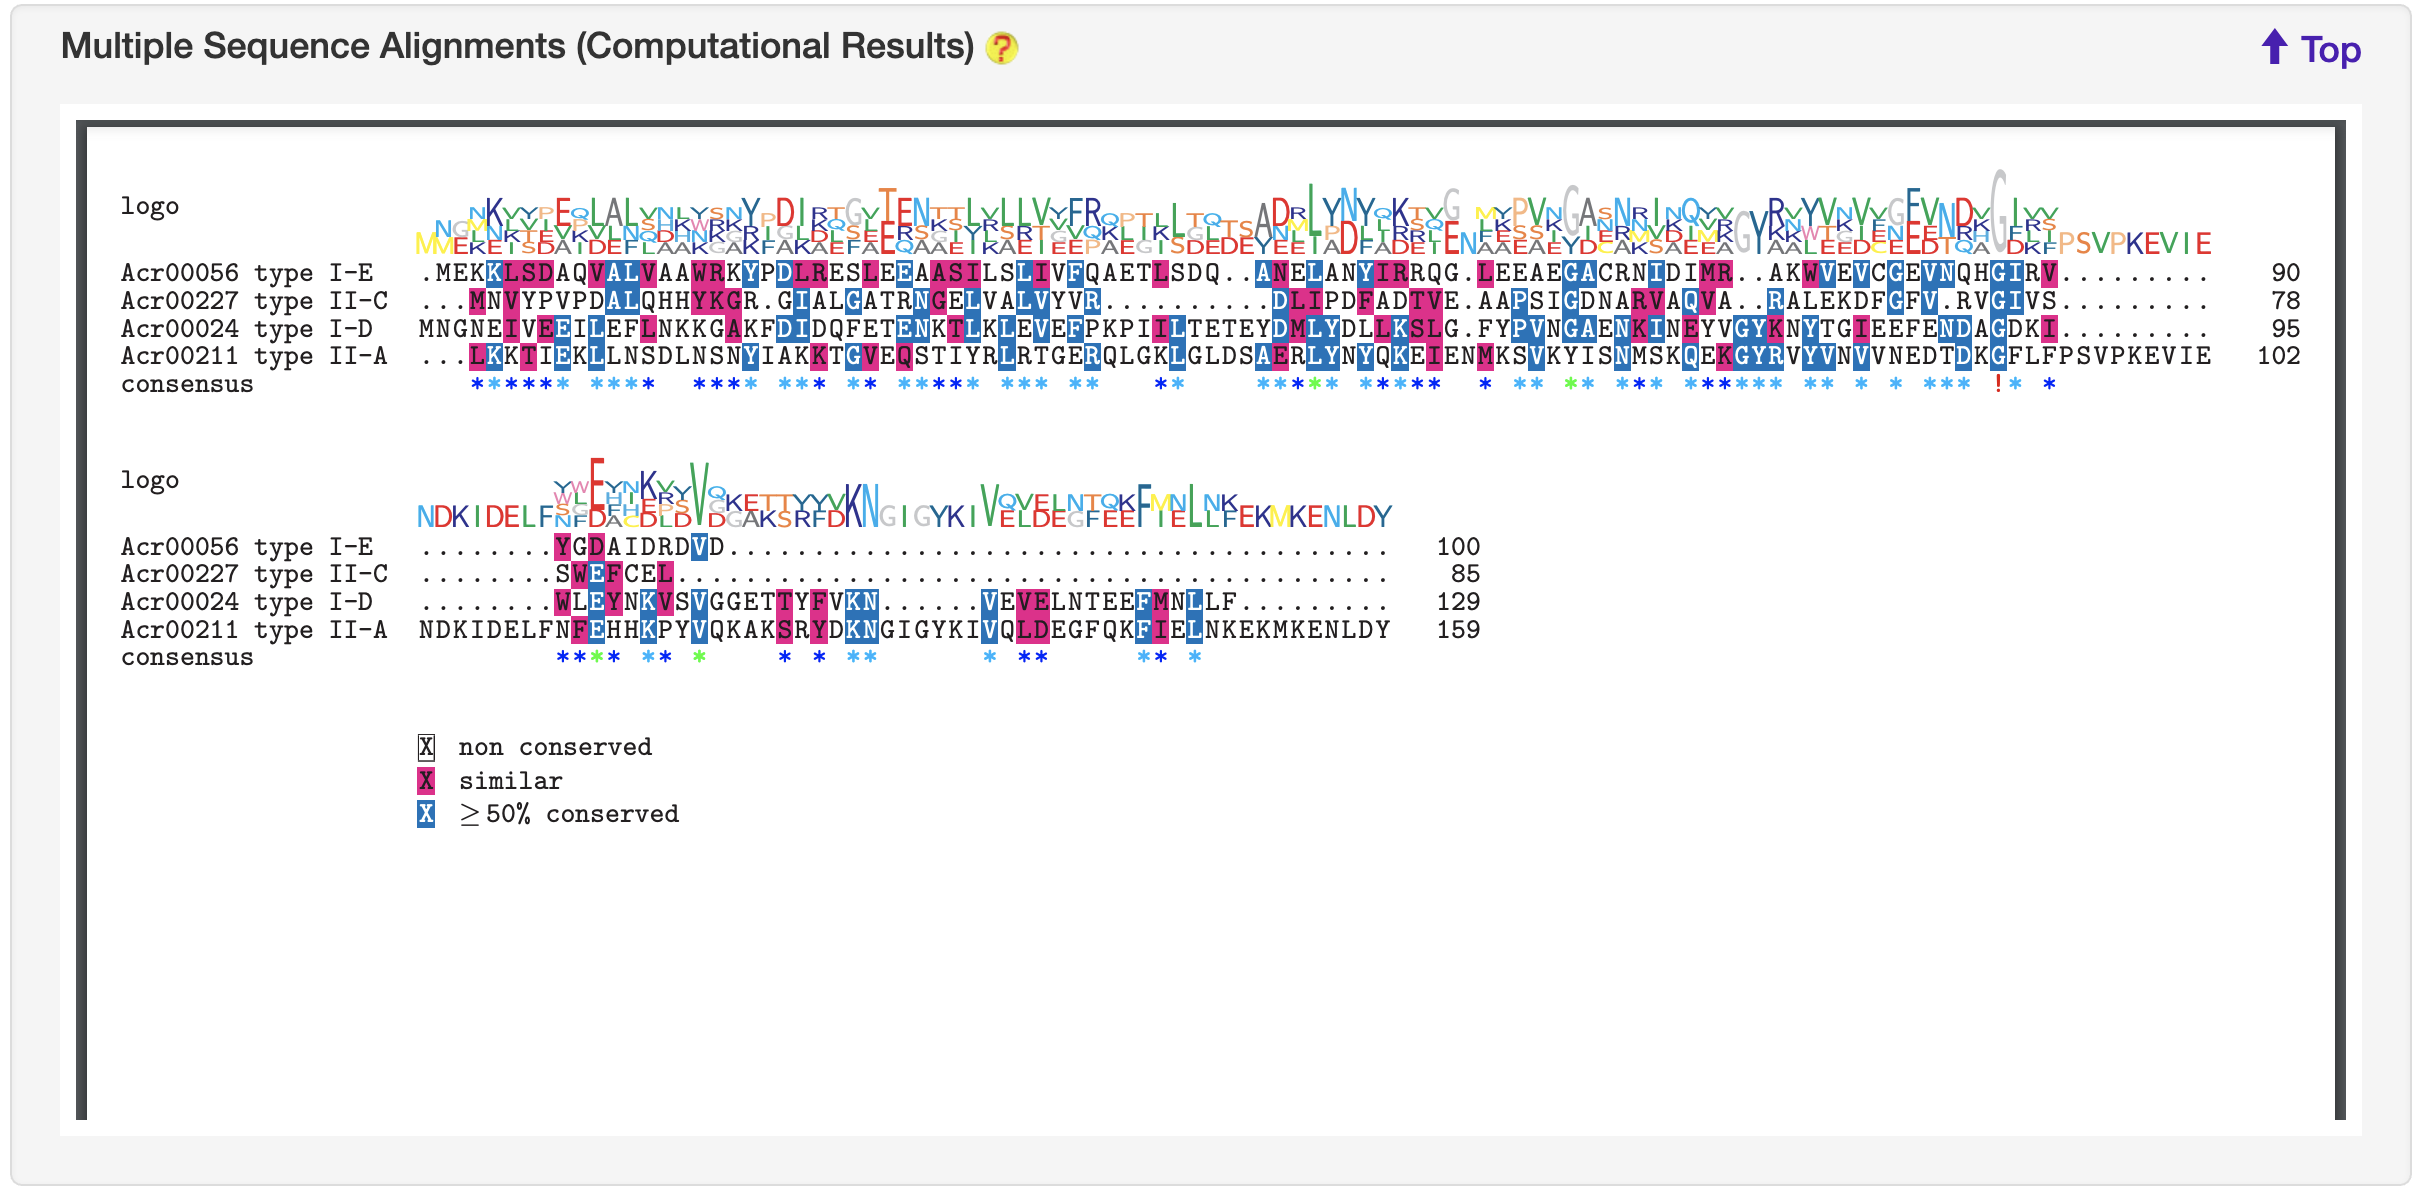
1.5.6 Multiple Sequence Alignments
For each entry, blast-2.8.1+ was used to search against experimentally validated Acrs. This entry with its retrieved homologous sequences was used to generate multiple alignment file (executed by ClustalW but invoked by msa) and then visualized by the the R library msa.
-
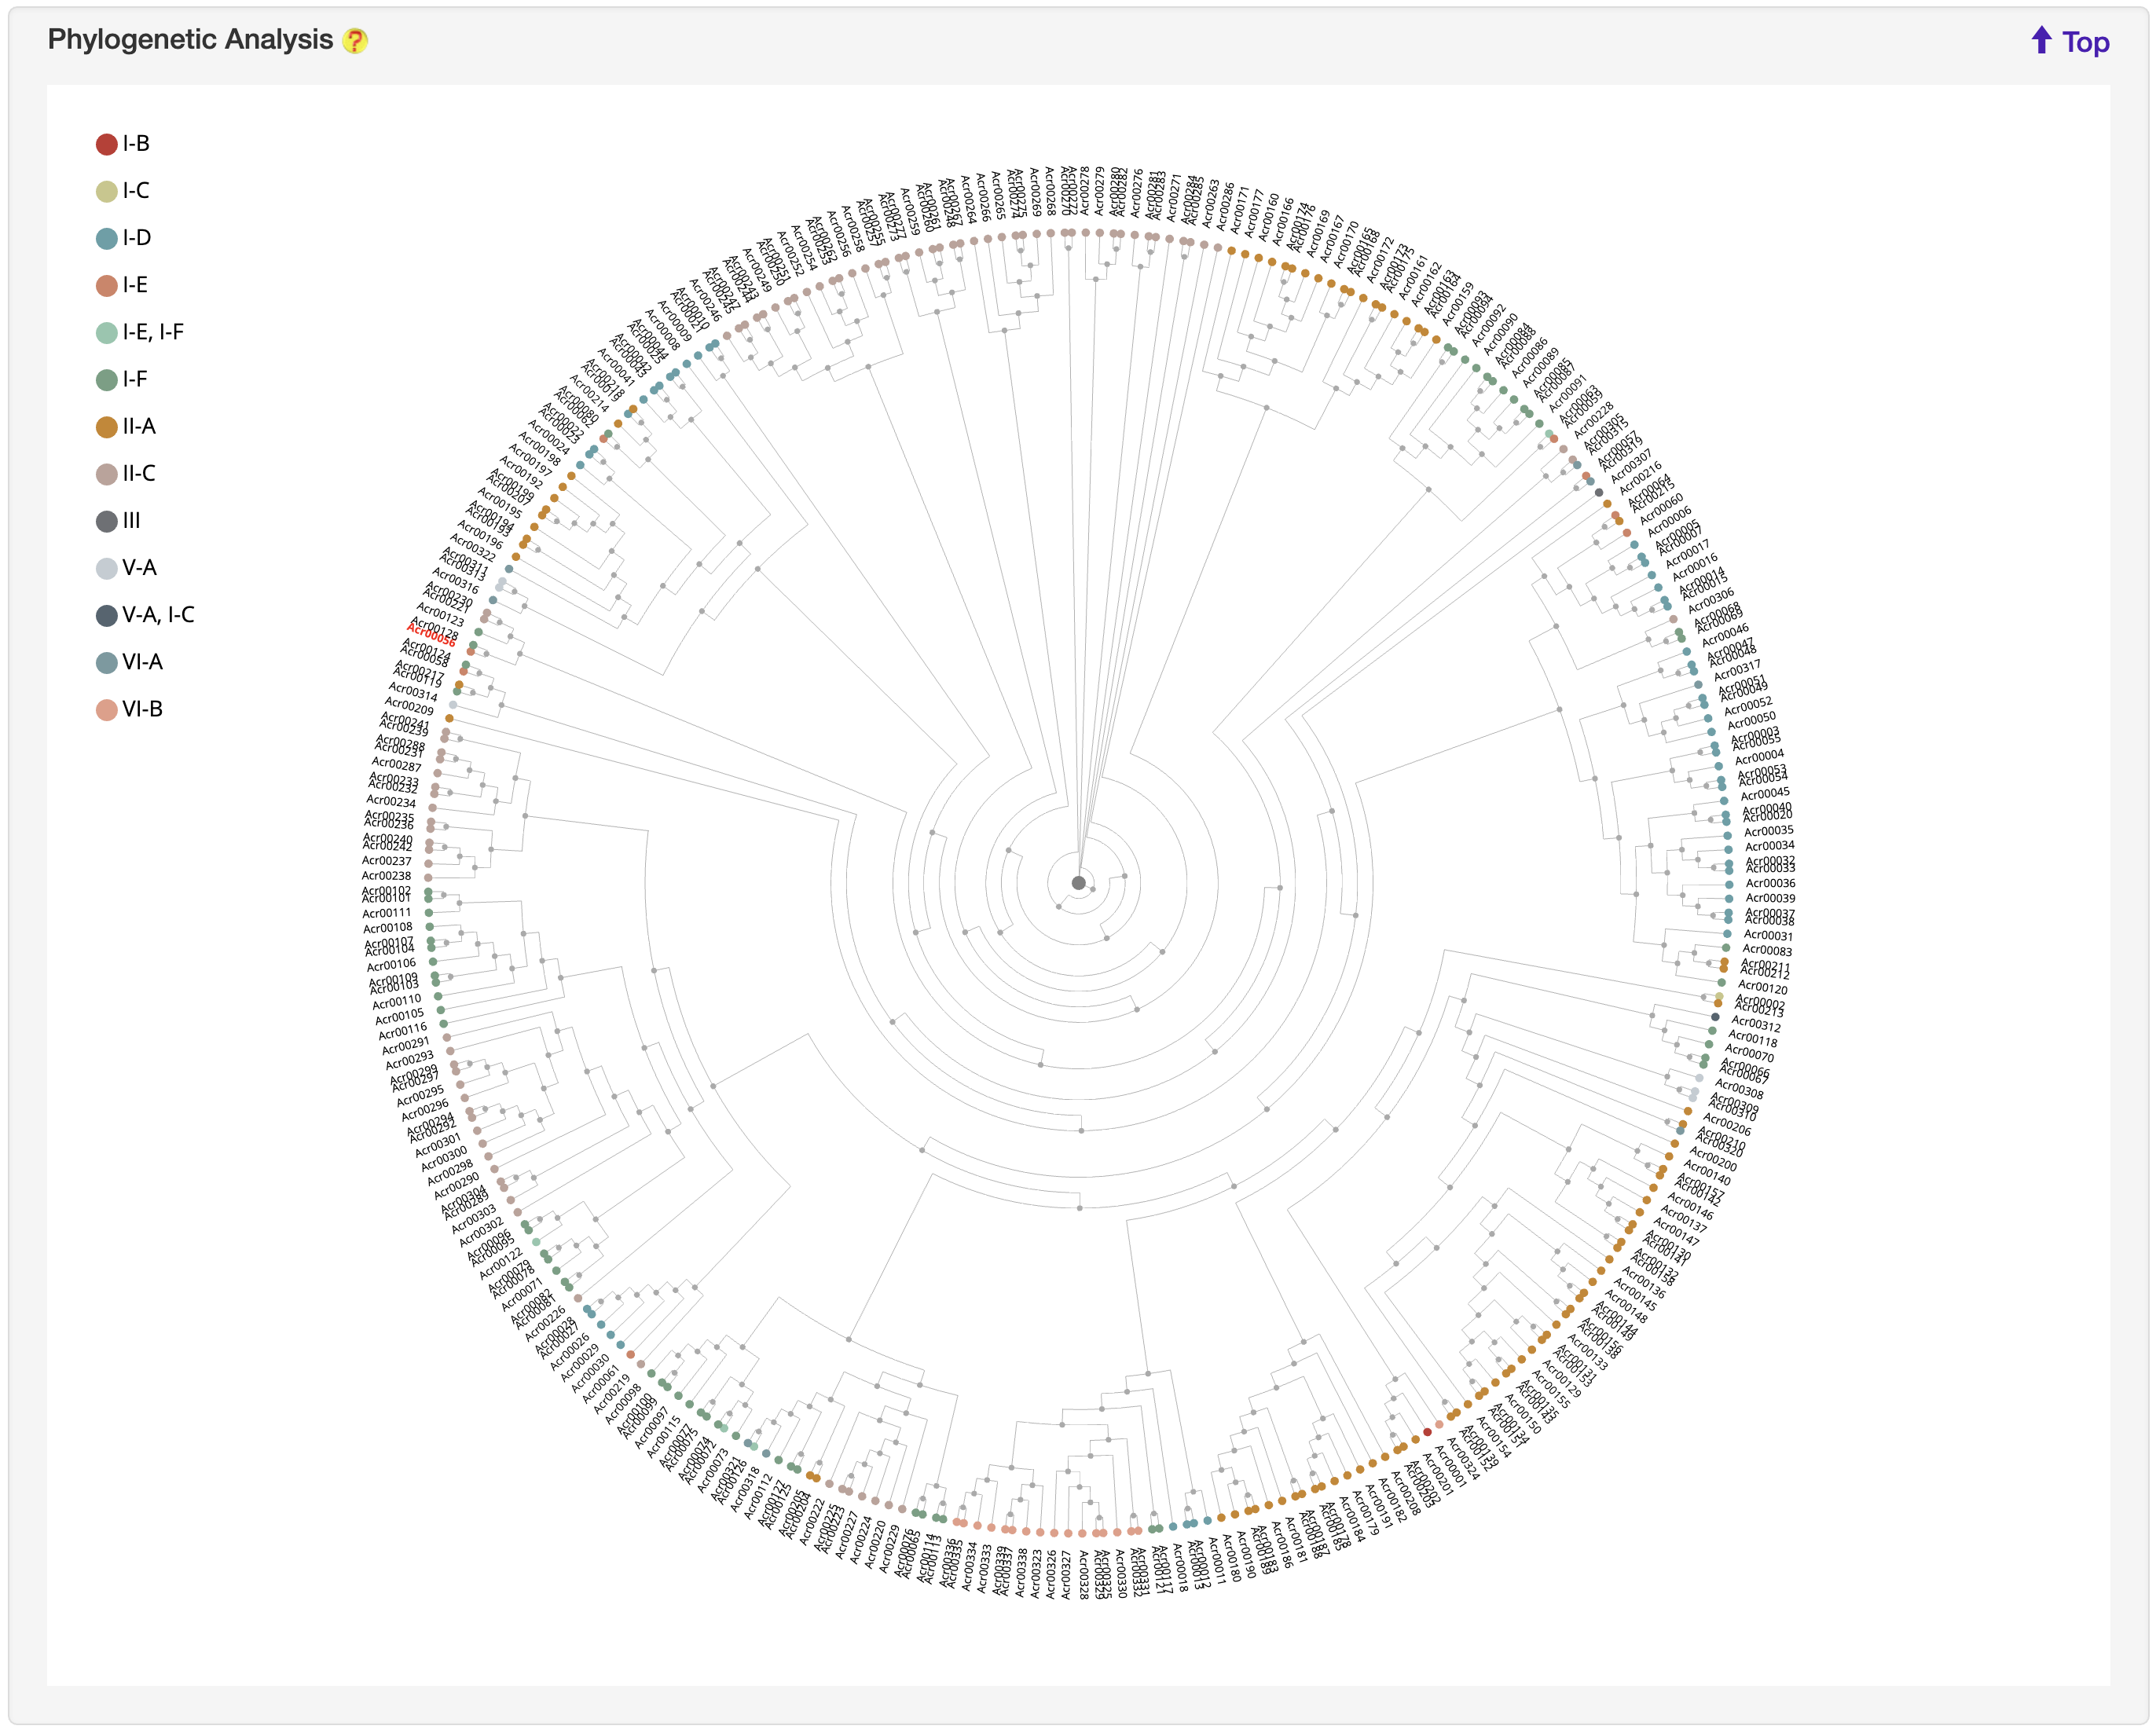
1.5.7 Phylogenetic Analysis
For each entry, the MAFFT v7.271 was used to generate multiple alignment results against experimentally validated Acrs, which was visualized by jsPhyloSVG. Current entry is highlighted in yellow.
-
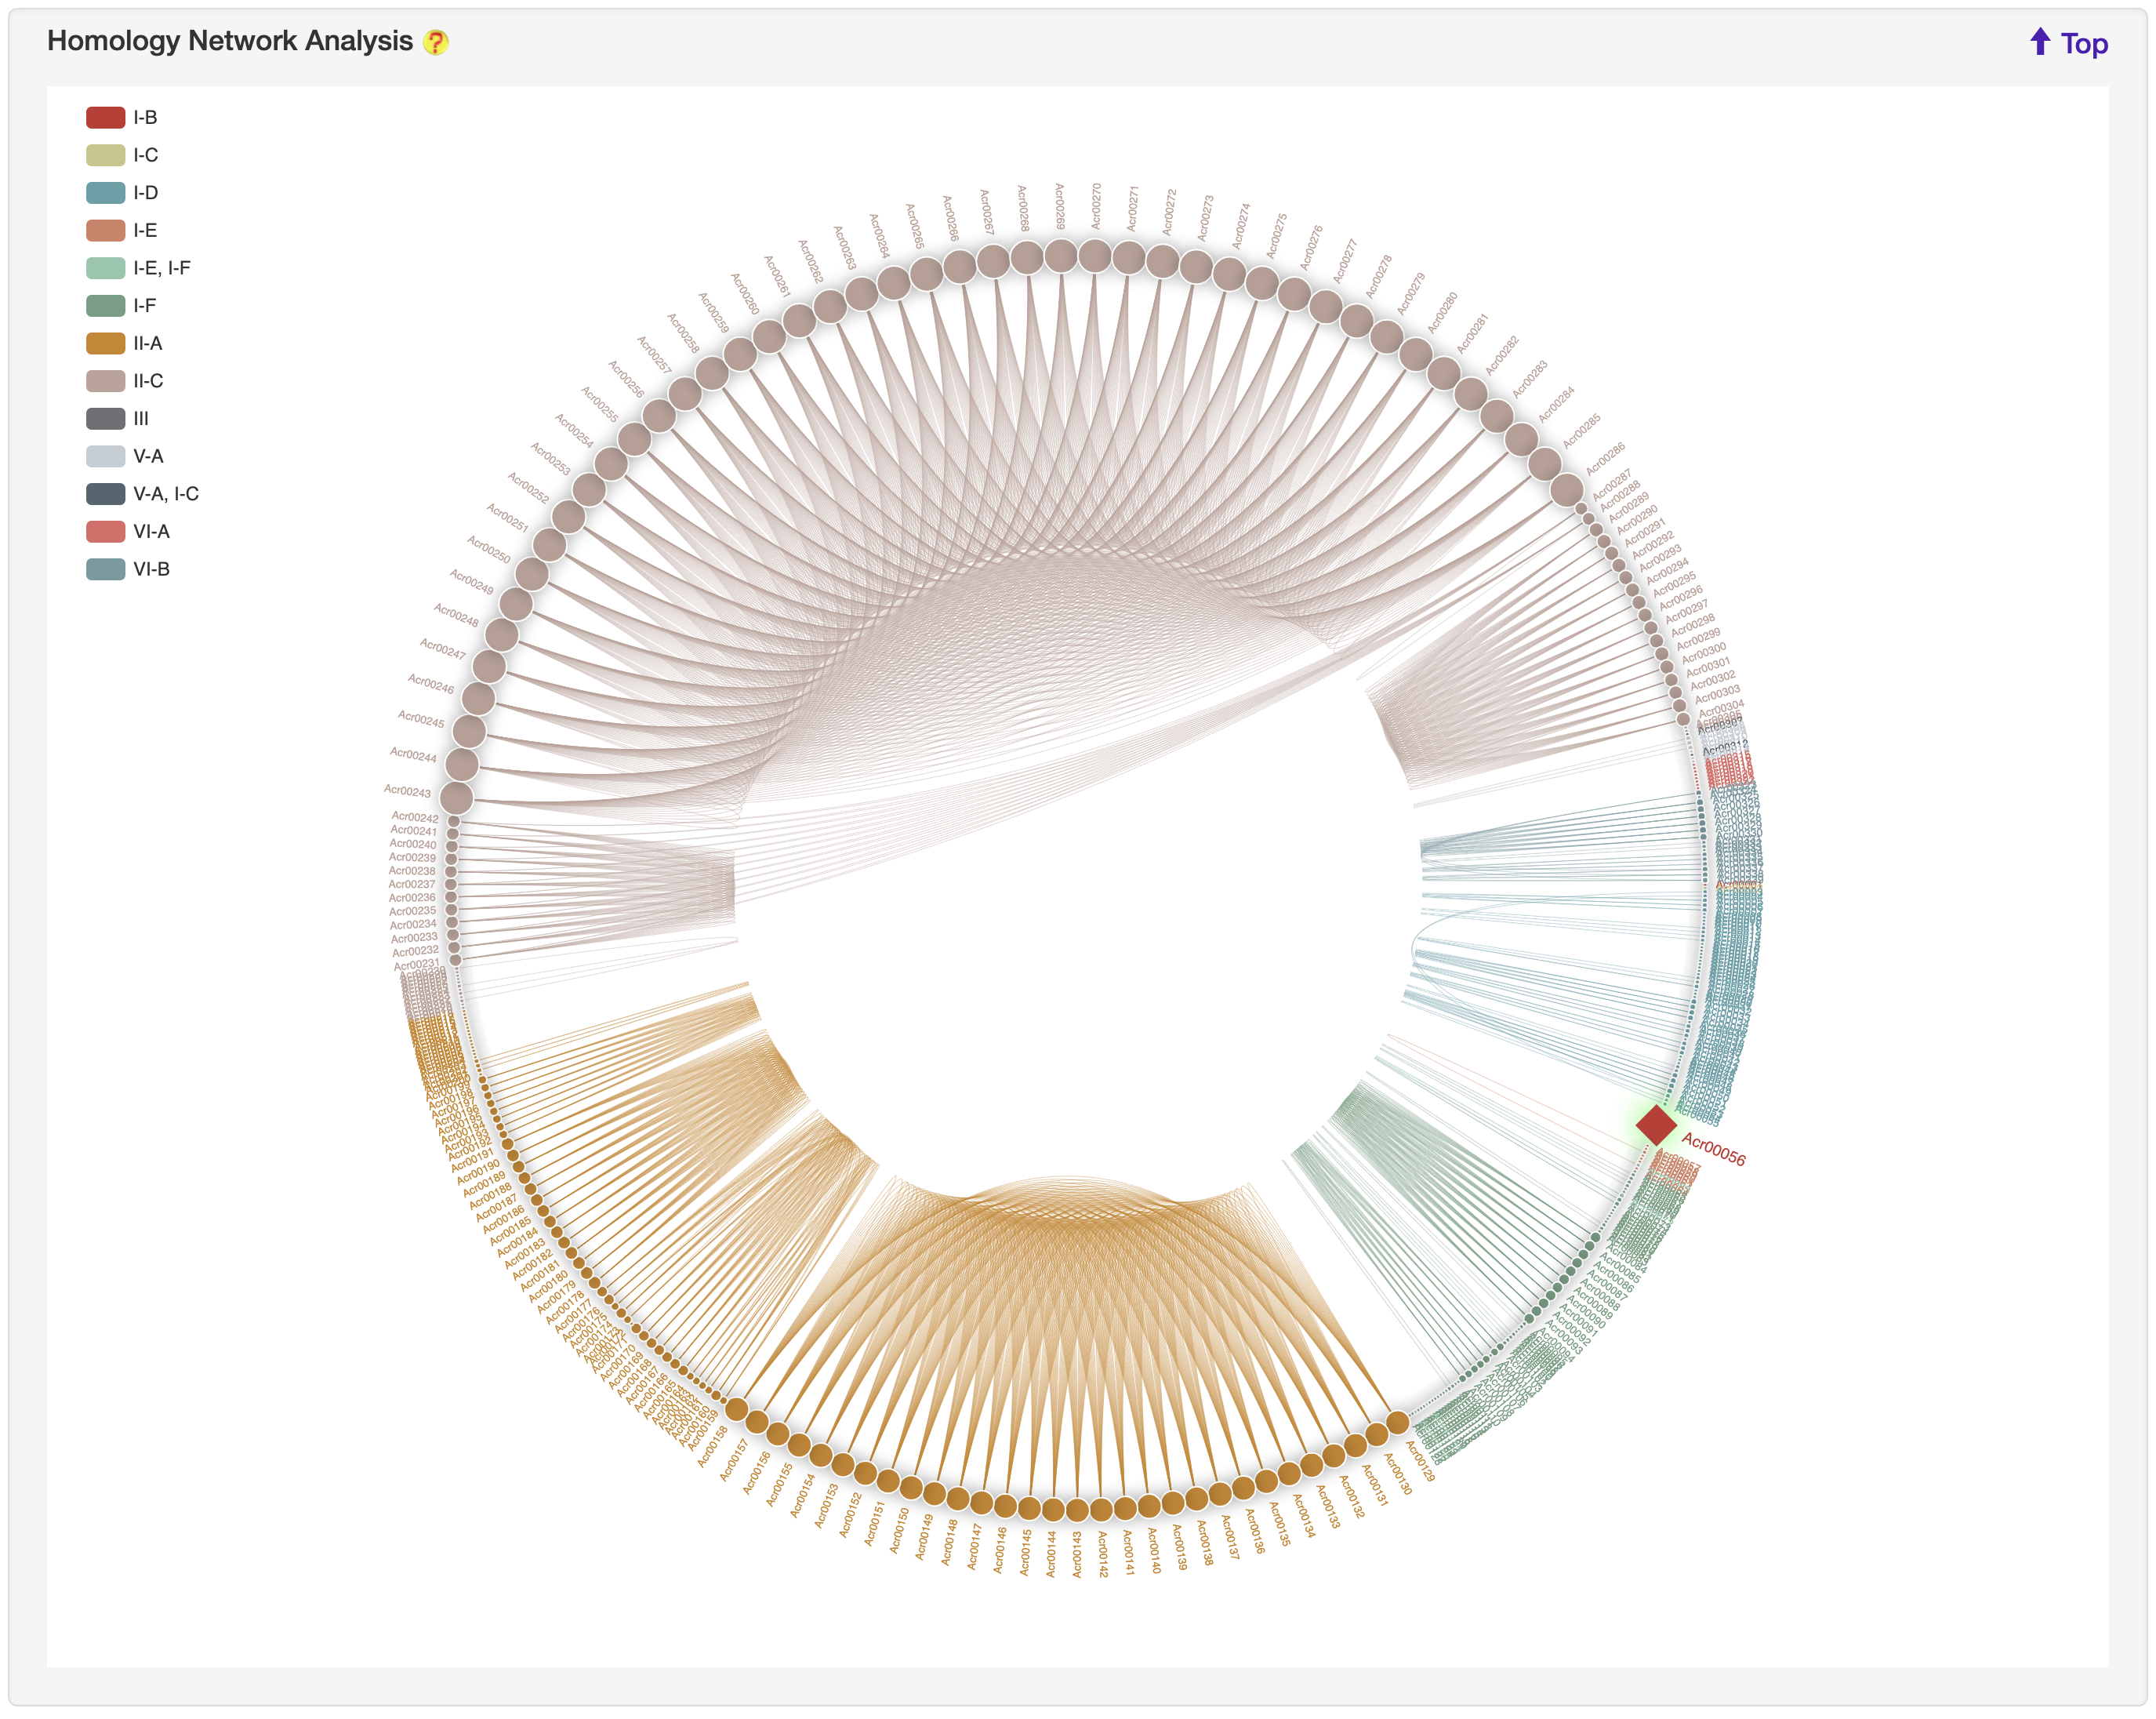
1.5.8 Homology network
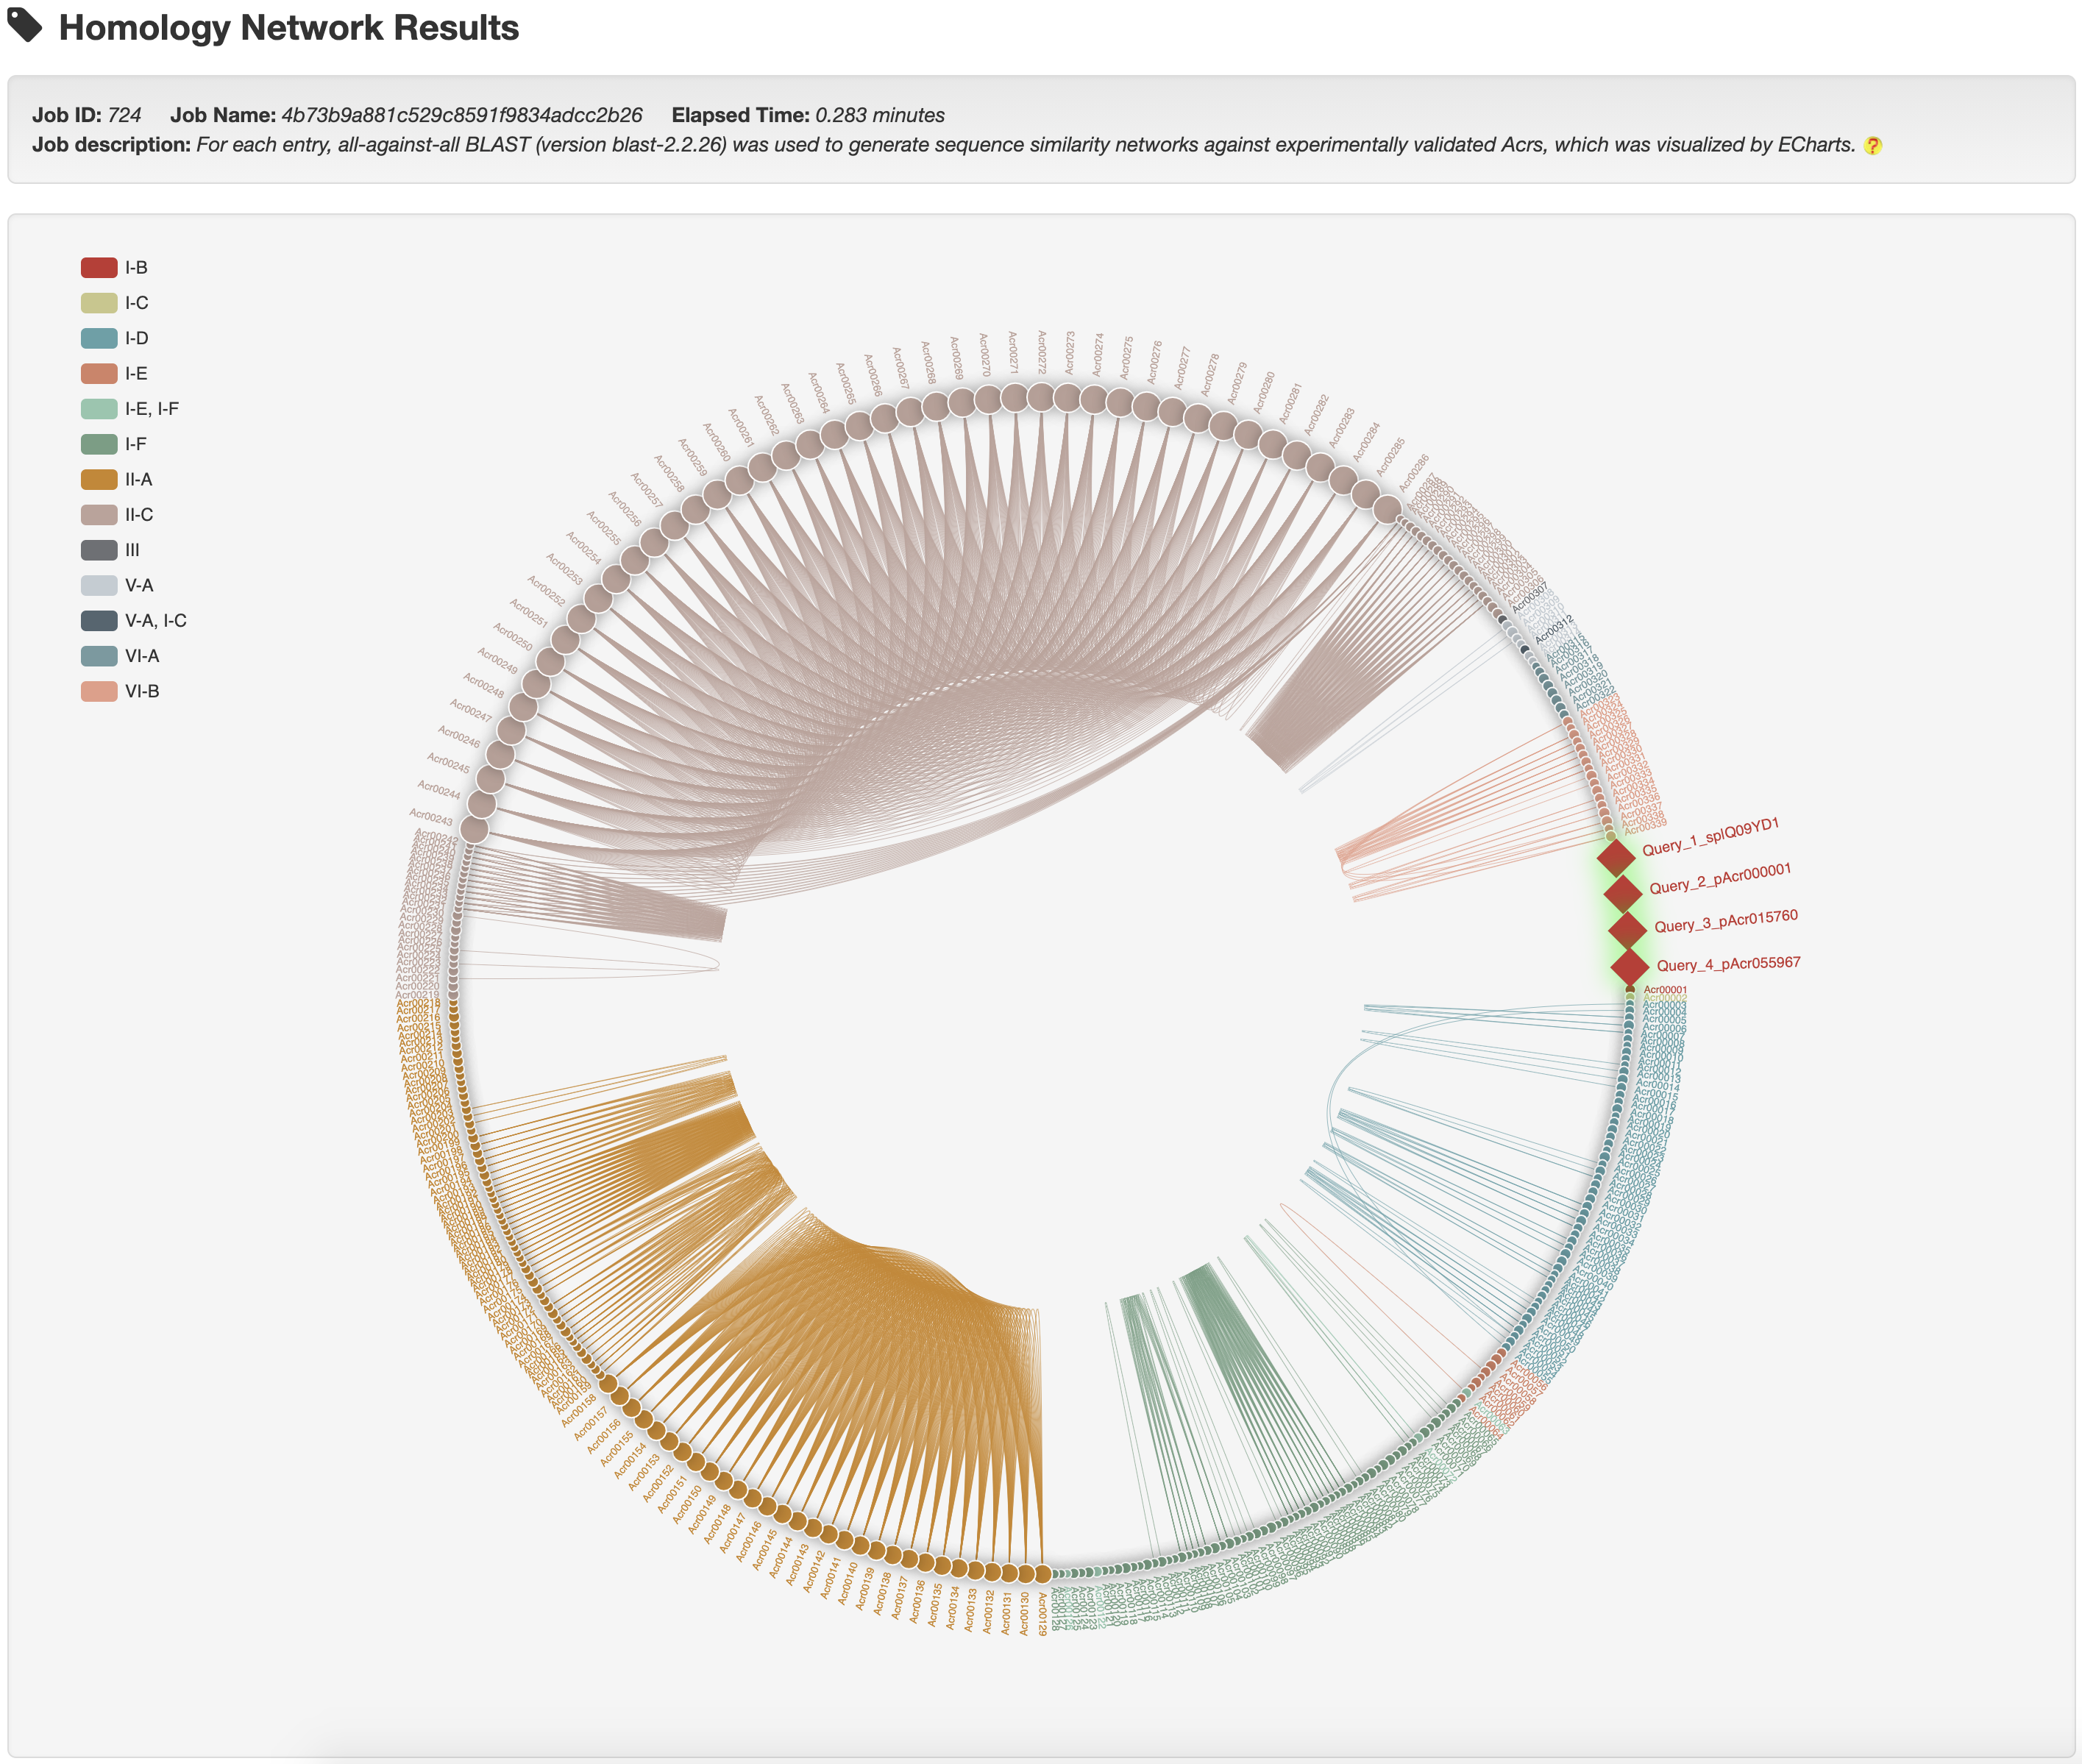
For each entry, the all-against-all BLAST (version blast-2.2.26) was used upon itself and experimentally validated Acrs to generate the sequence similarity network, visualized by ECharts. Current entry is highlighted by red rhombus.
2. PREDICTION
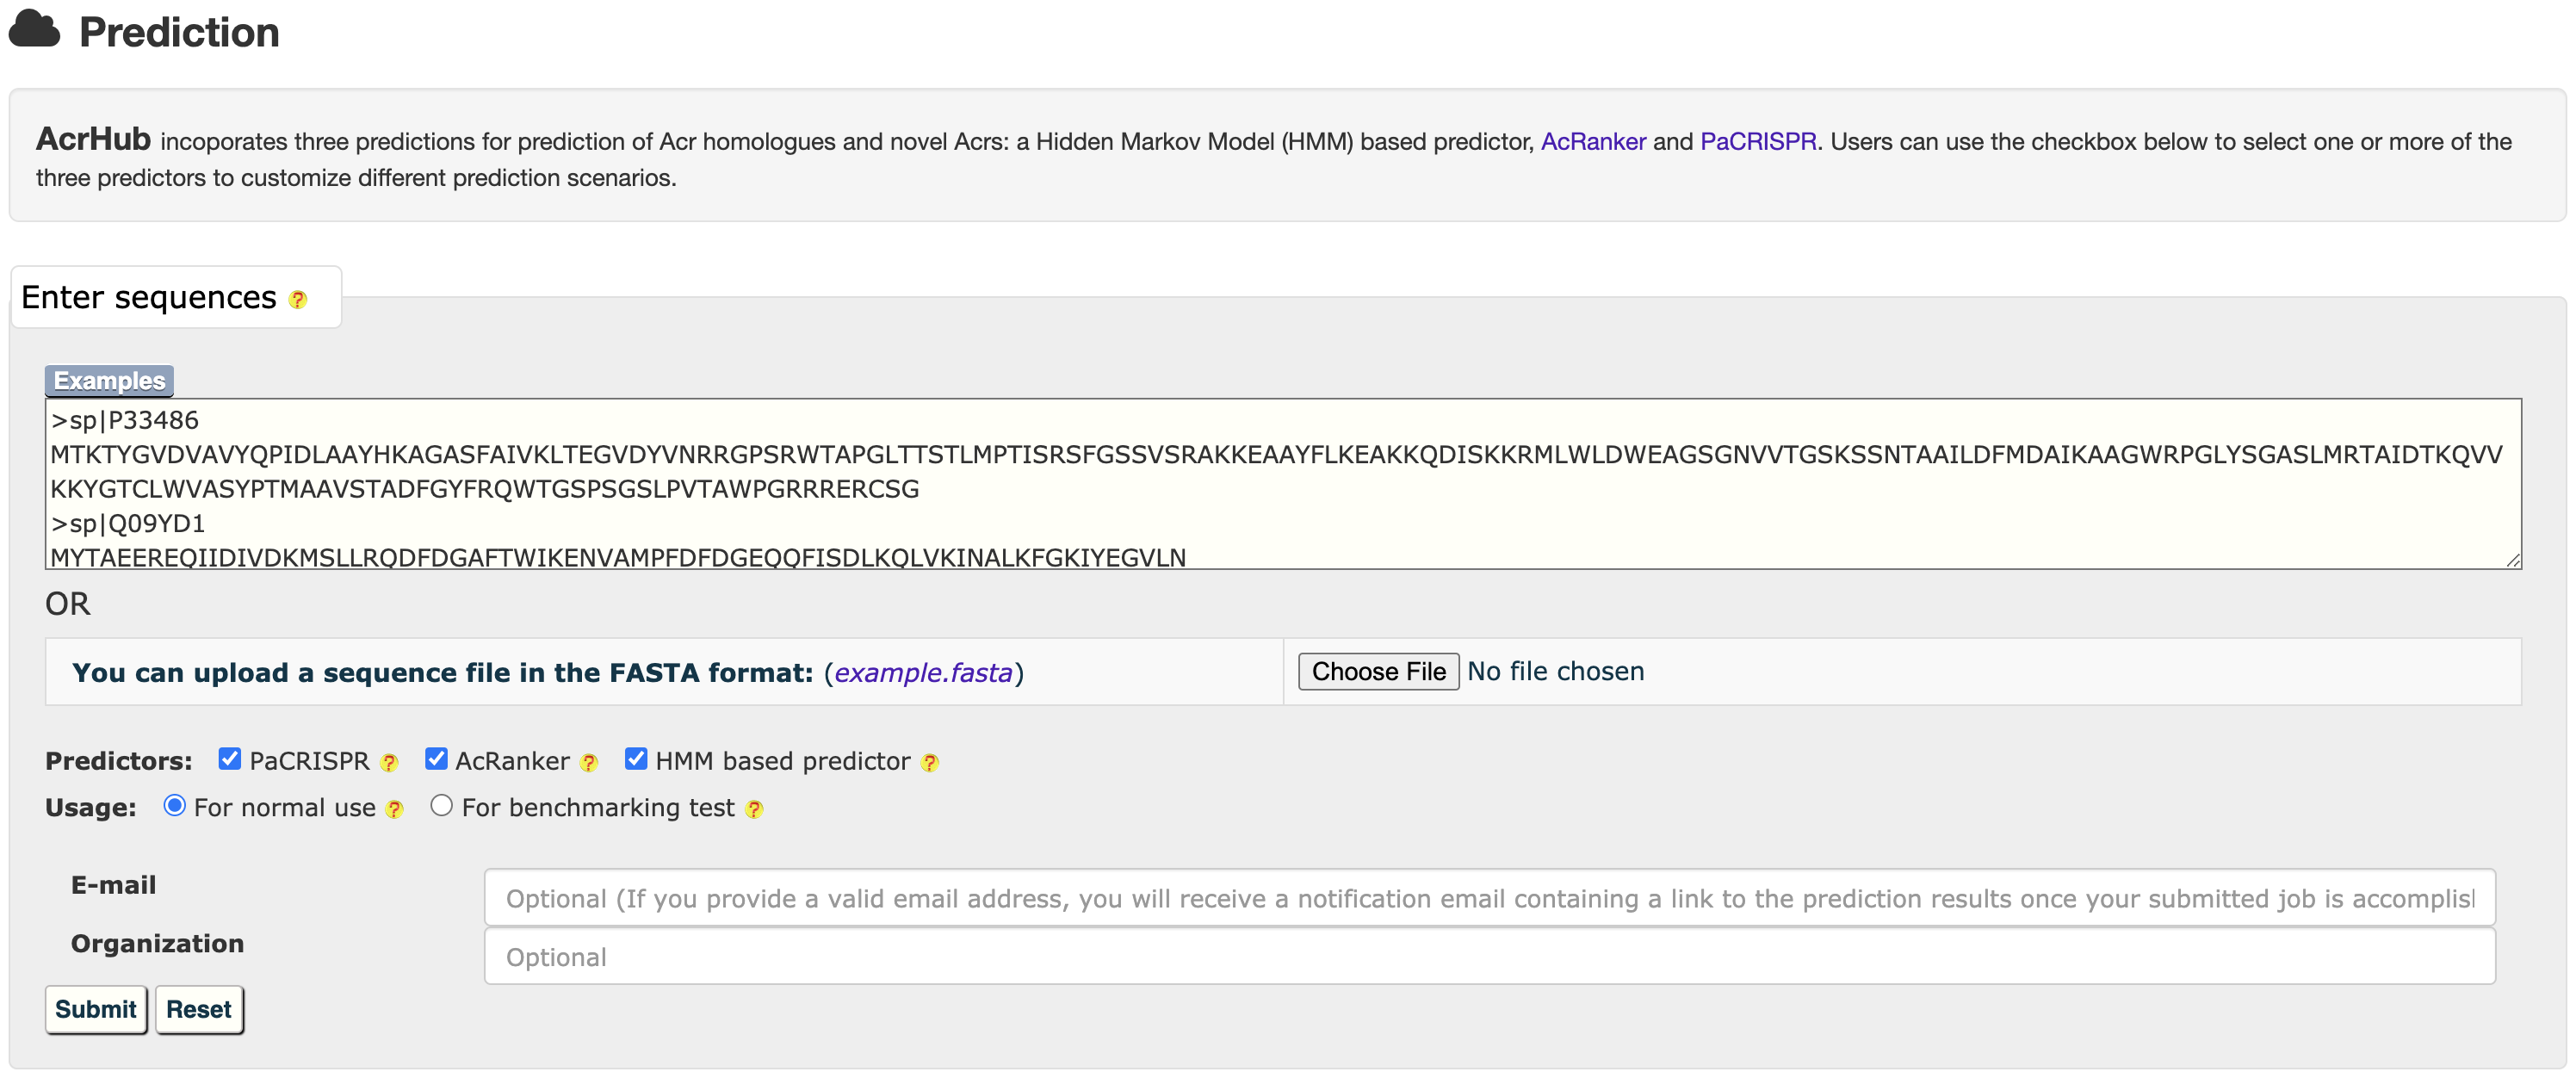
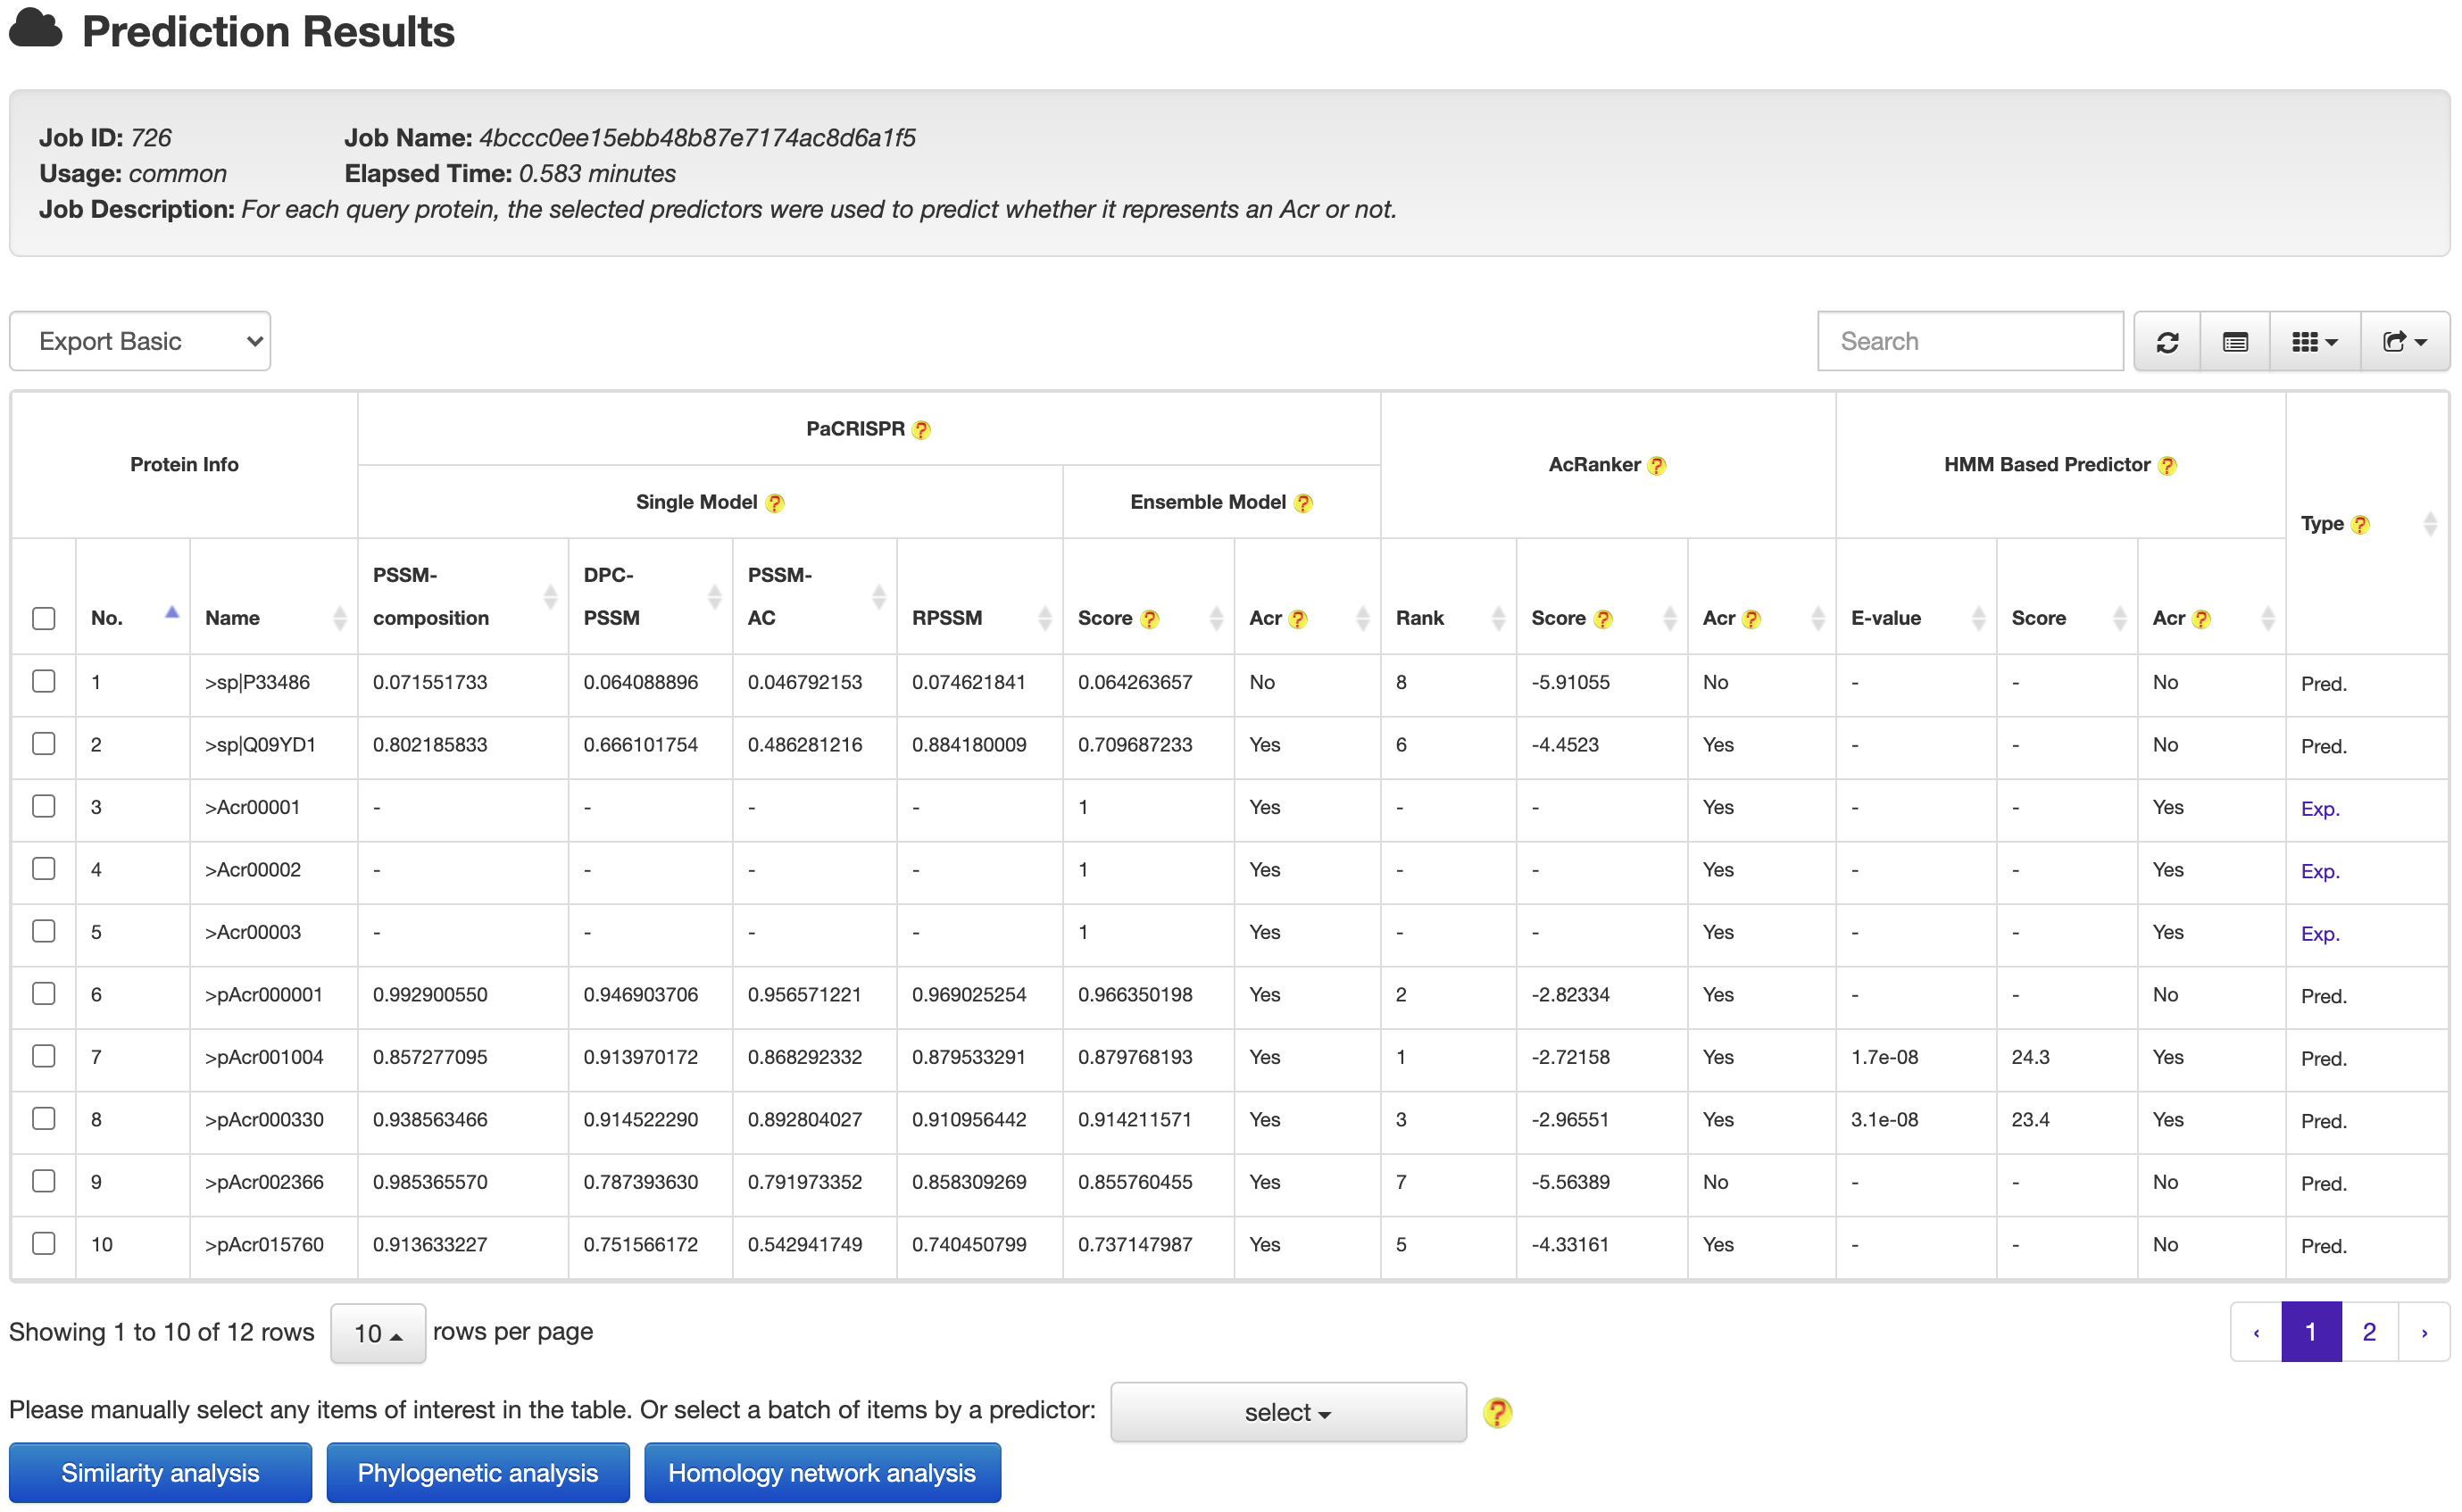
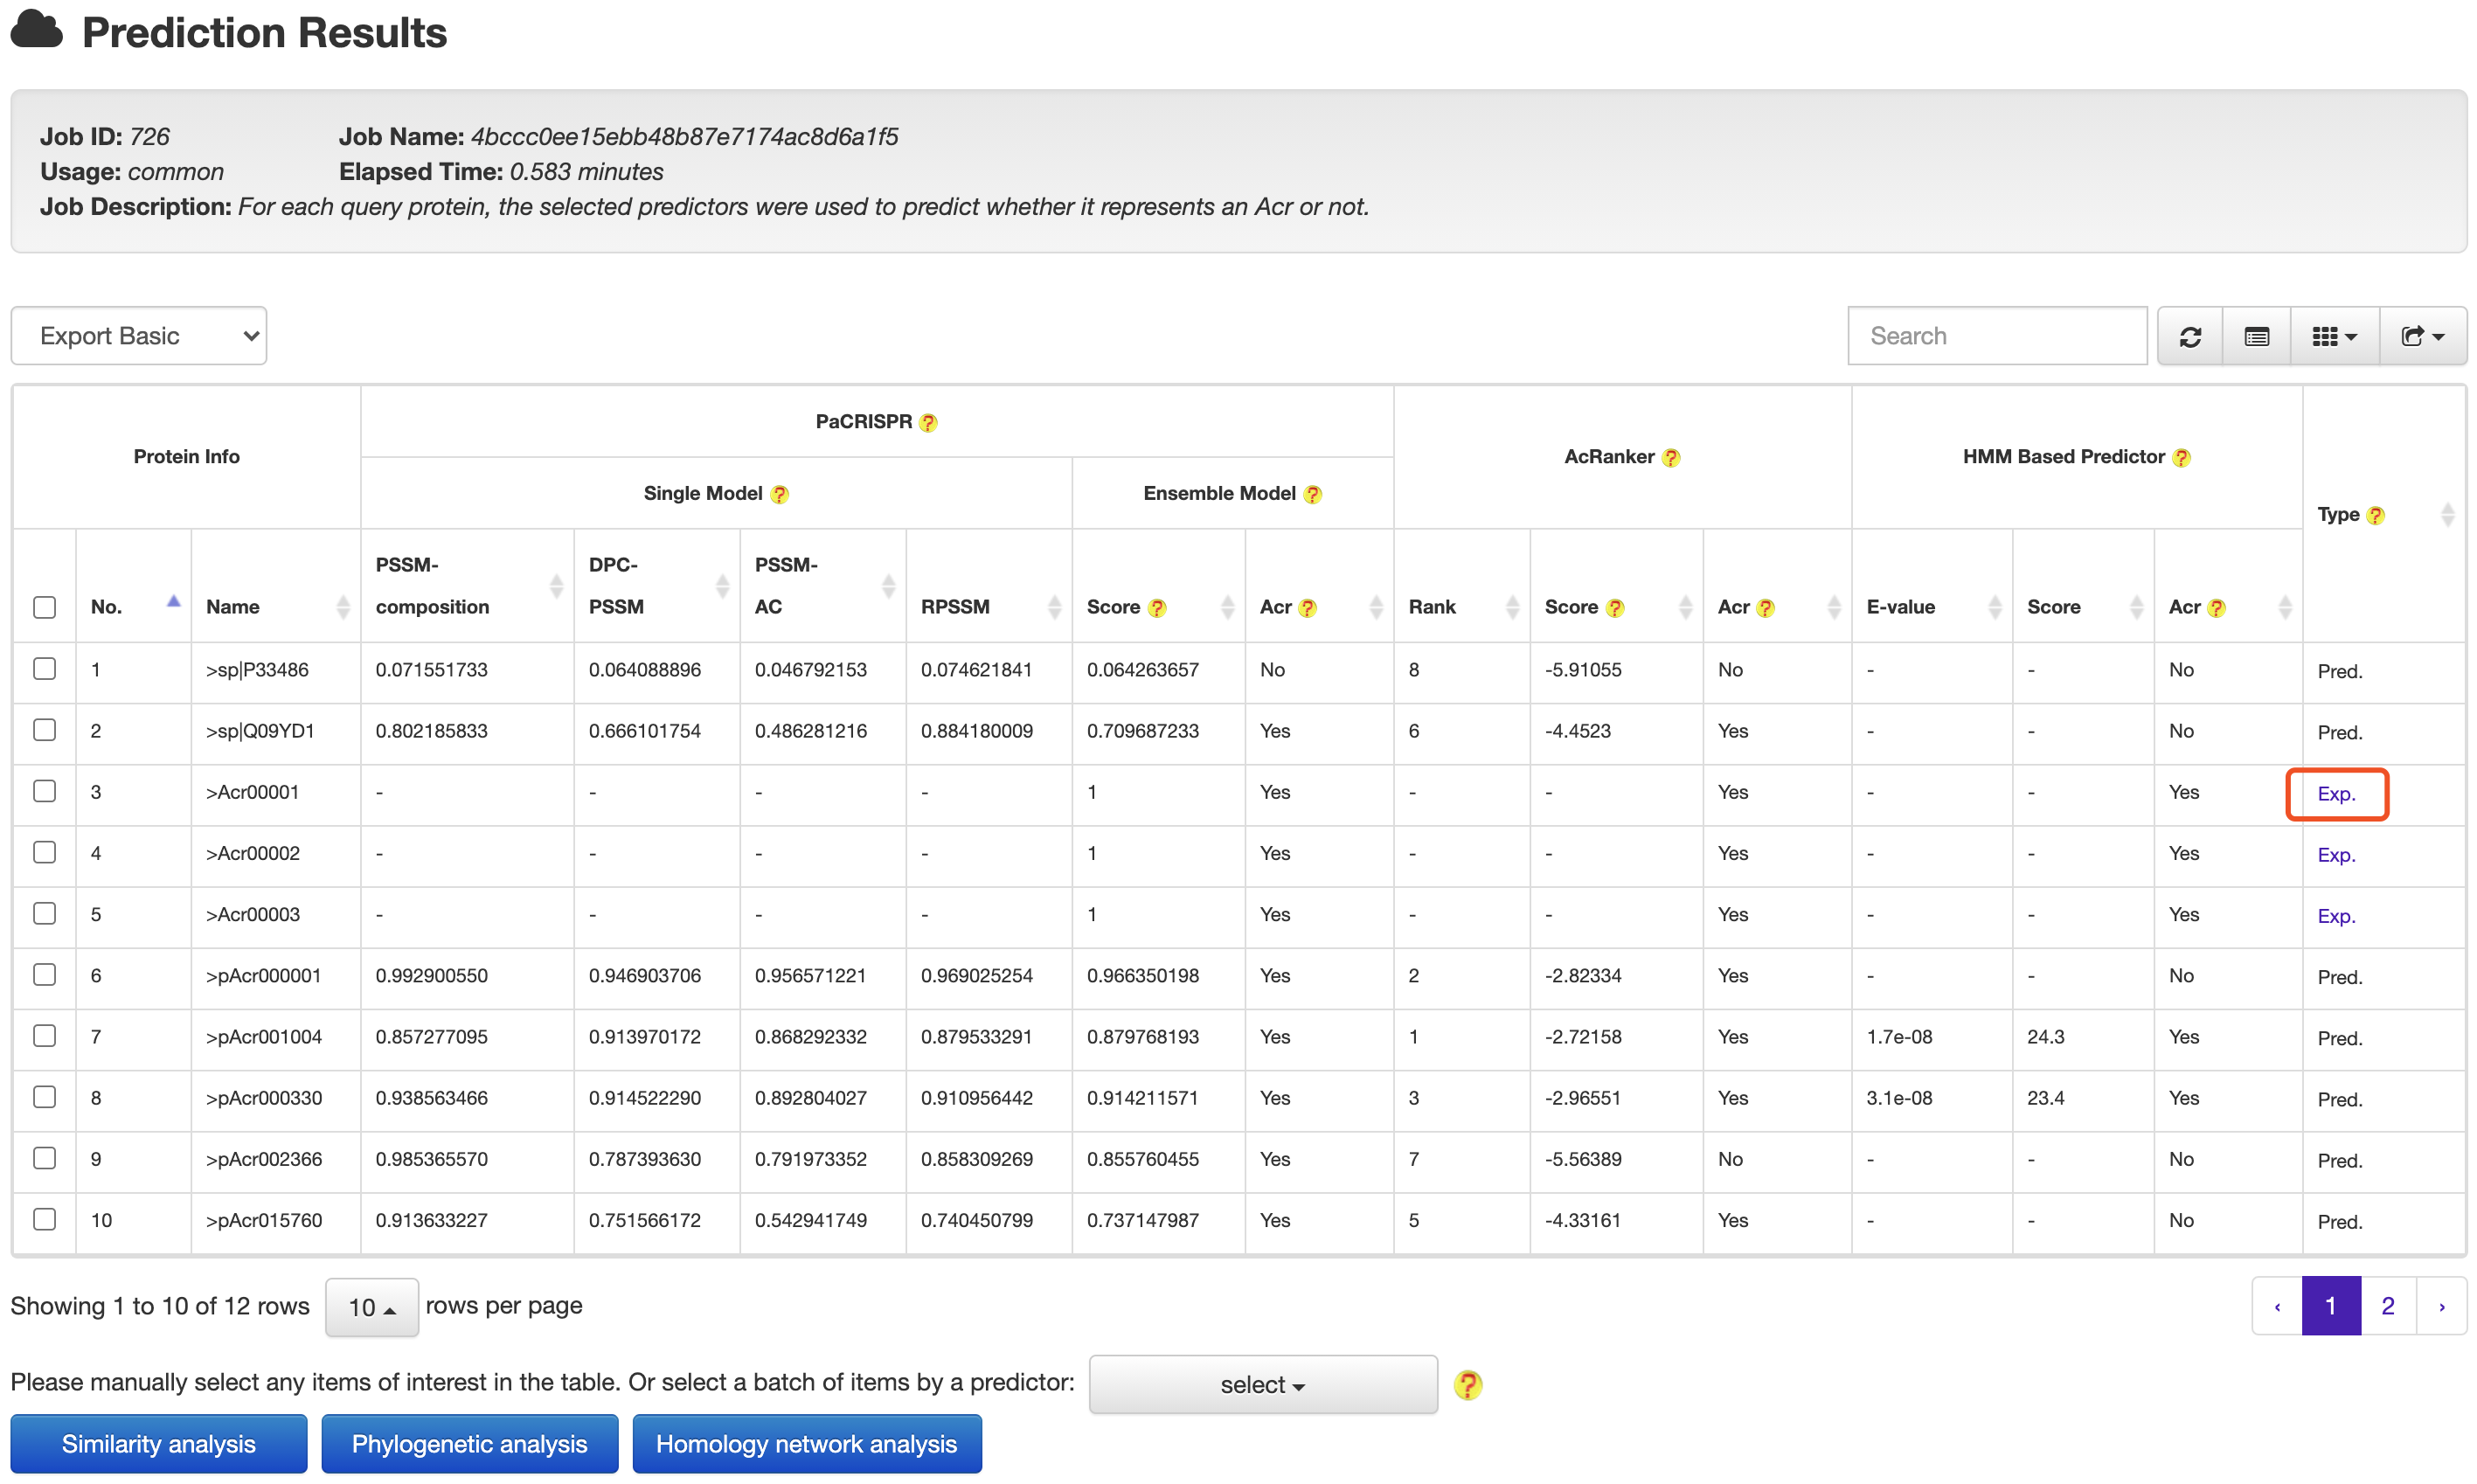
AcrHub provides prediction functions by integrating three predictors, including a Hidden Markov Model (HMM) based predictor, AcRanker and PaCRISPR, to predict homologous and novel Acrs.
3. RELATIONSHIP ANALYSIS
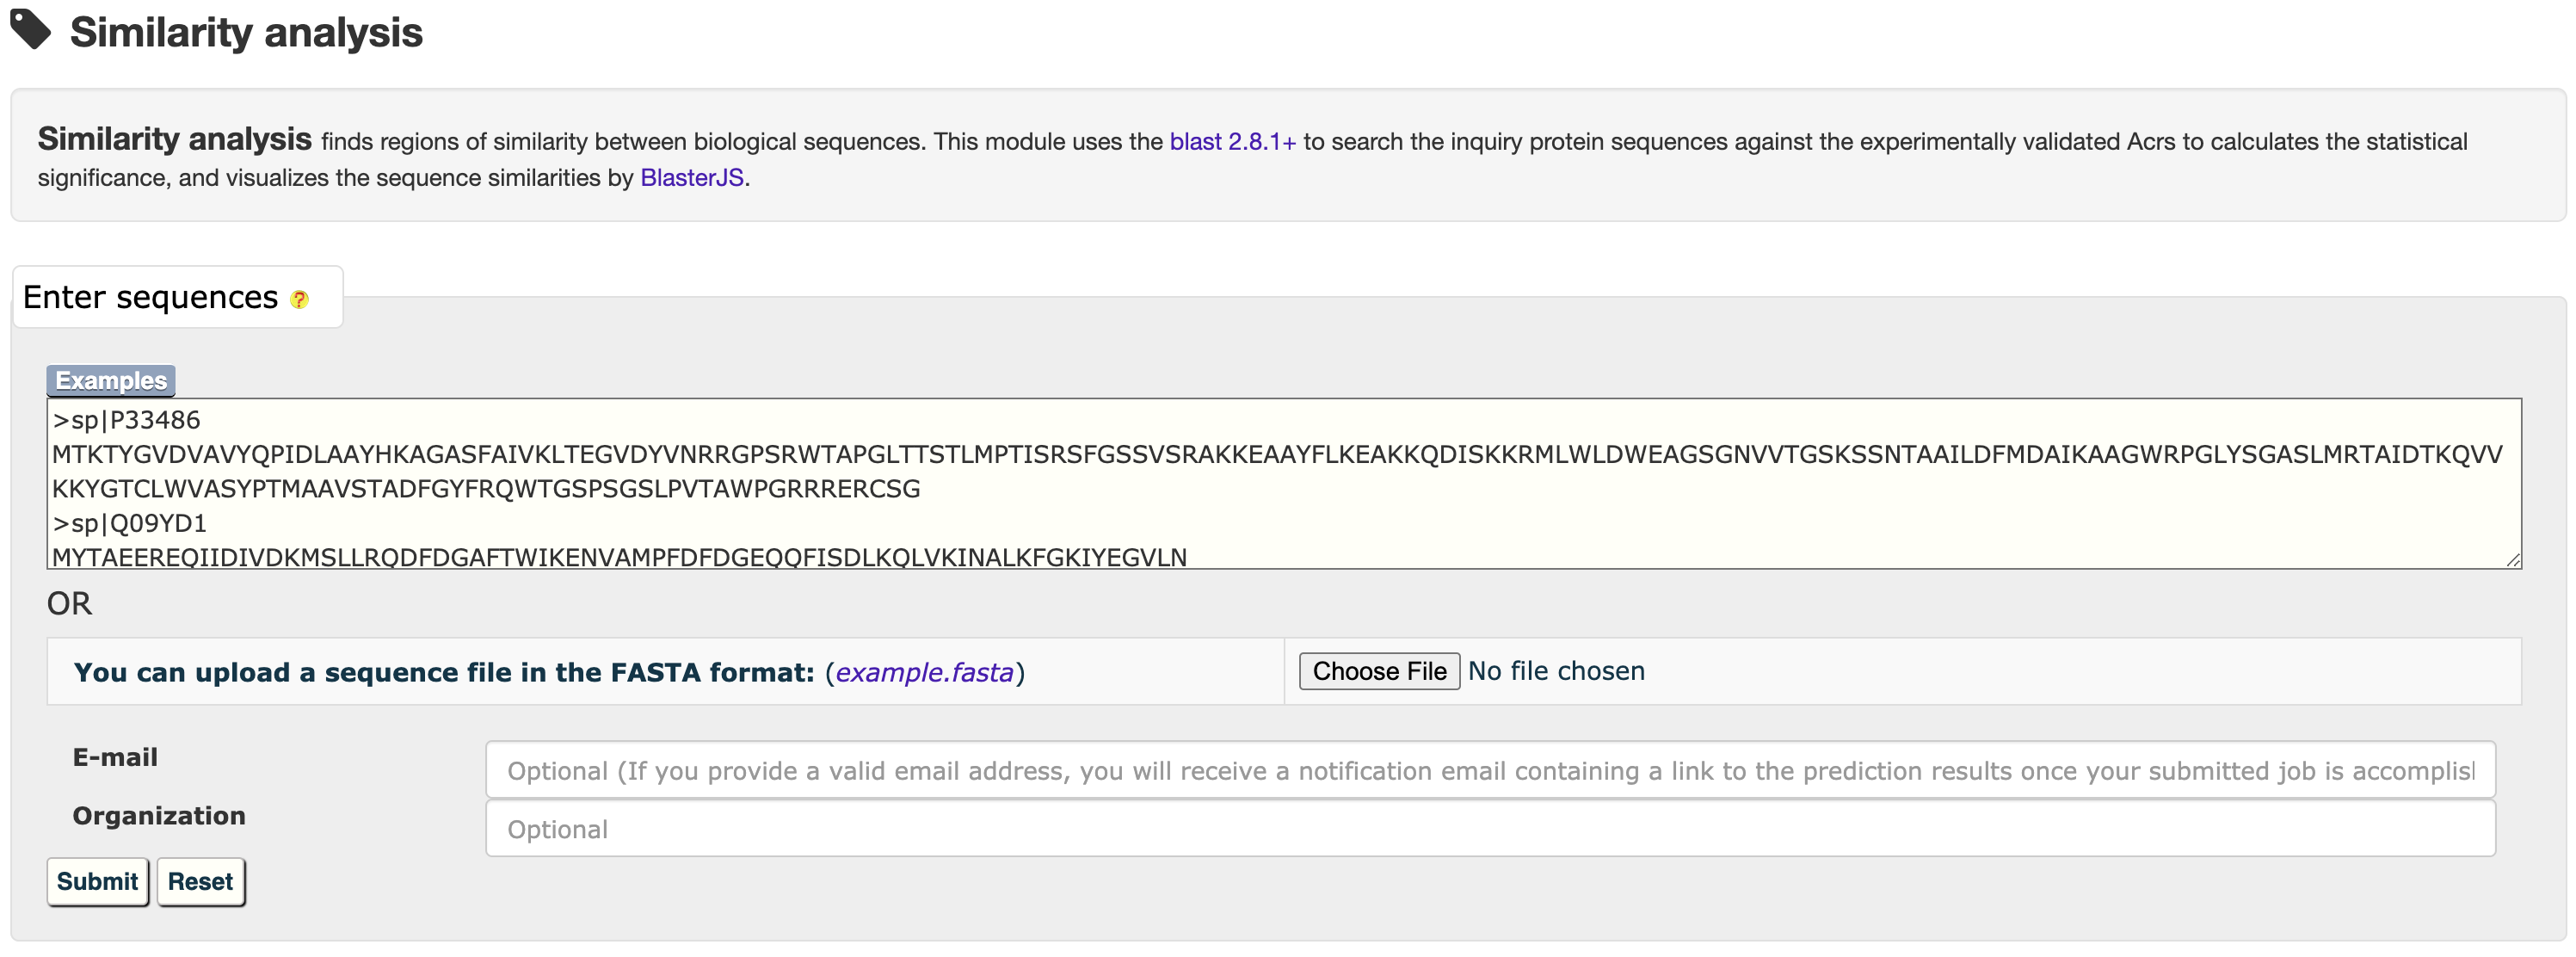
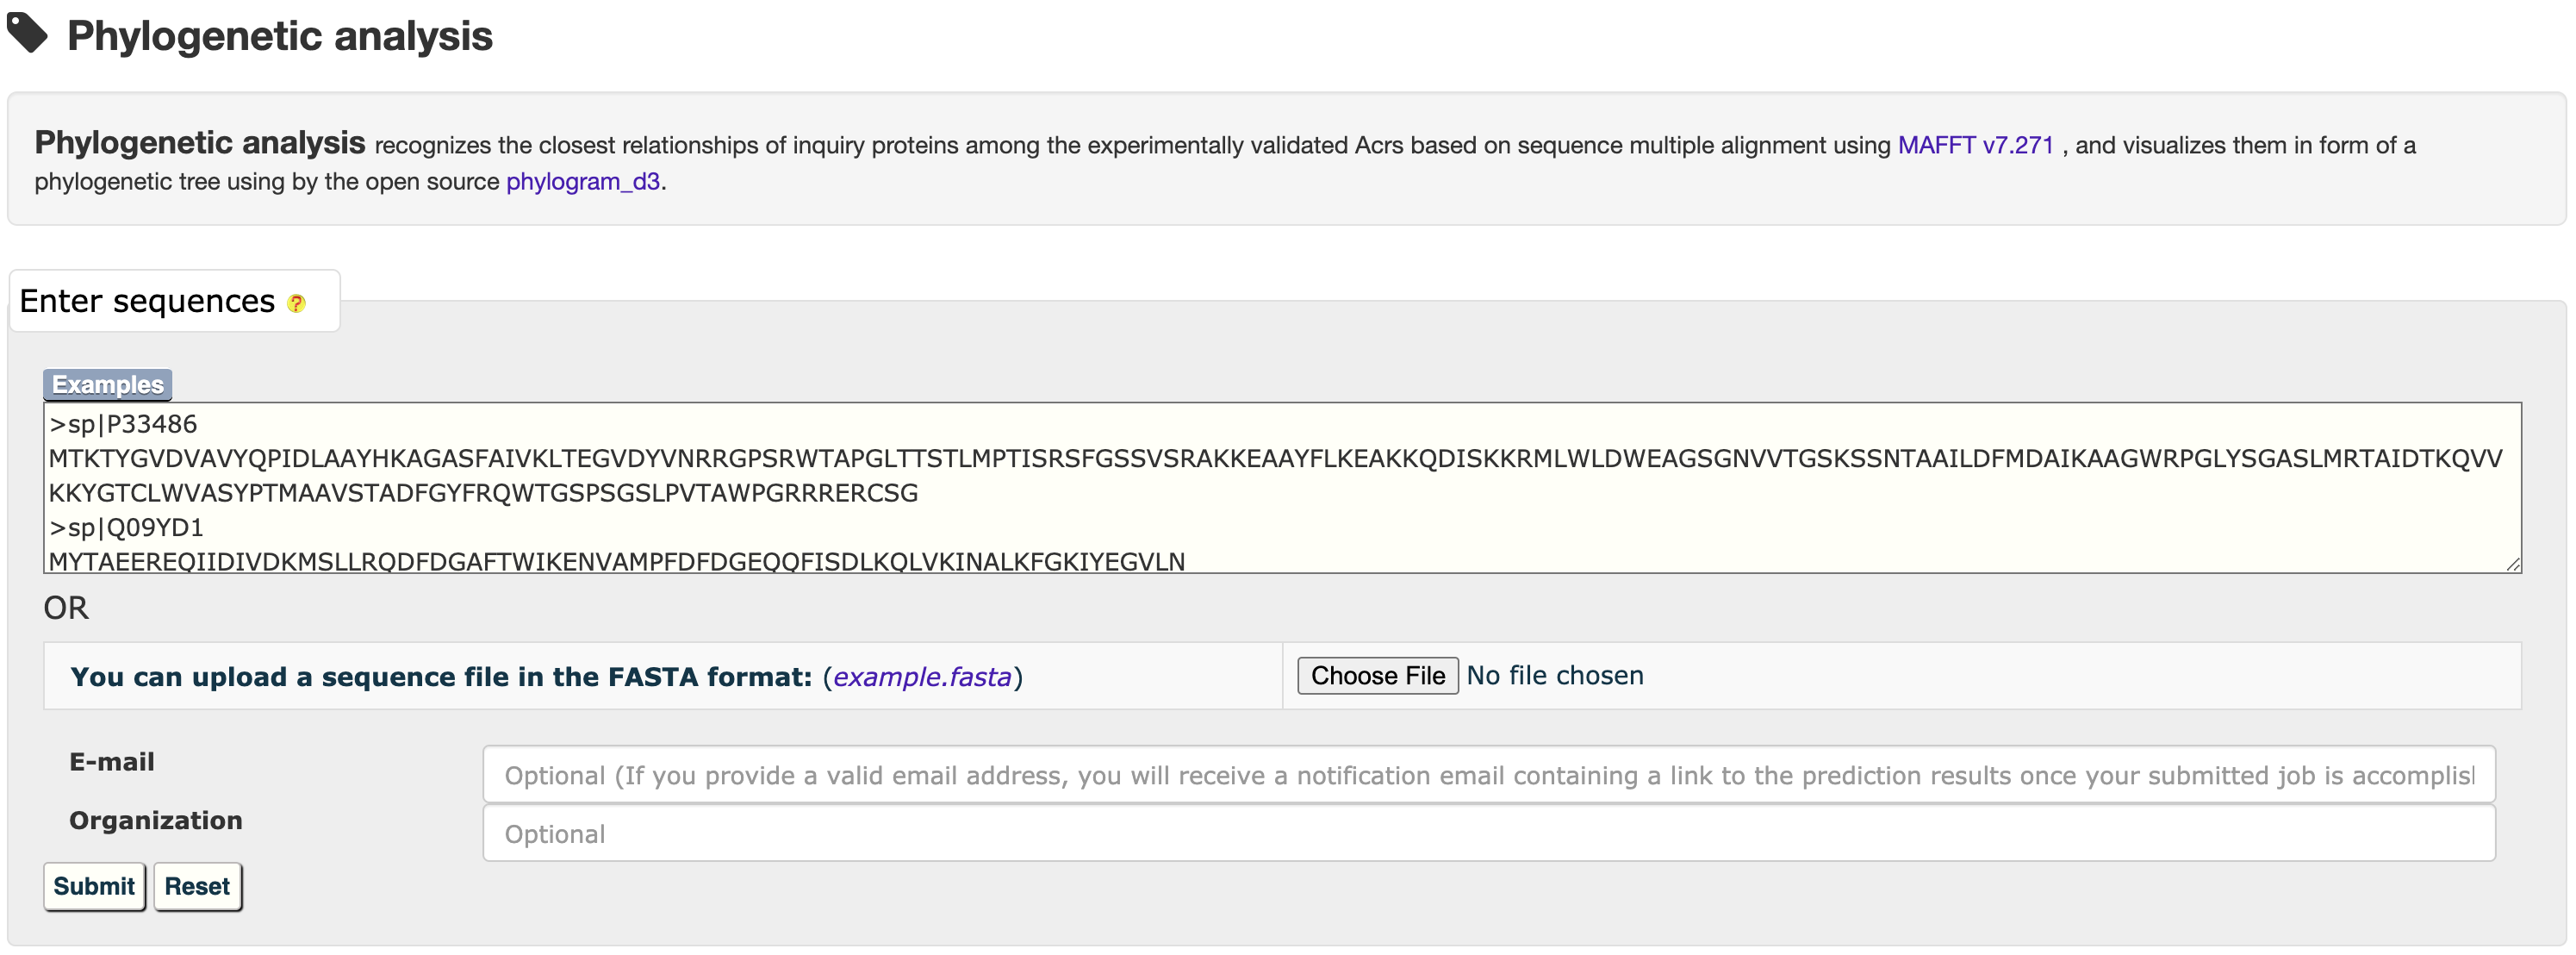
AcrHub provides three modules for users to analyze relationships between predicted and known Acrs, including similarity analysis, homology network analysis and phylogenetic analysis.
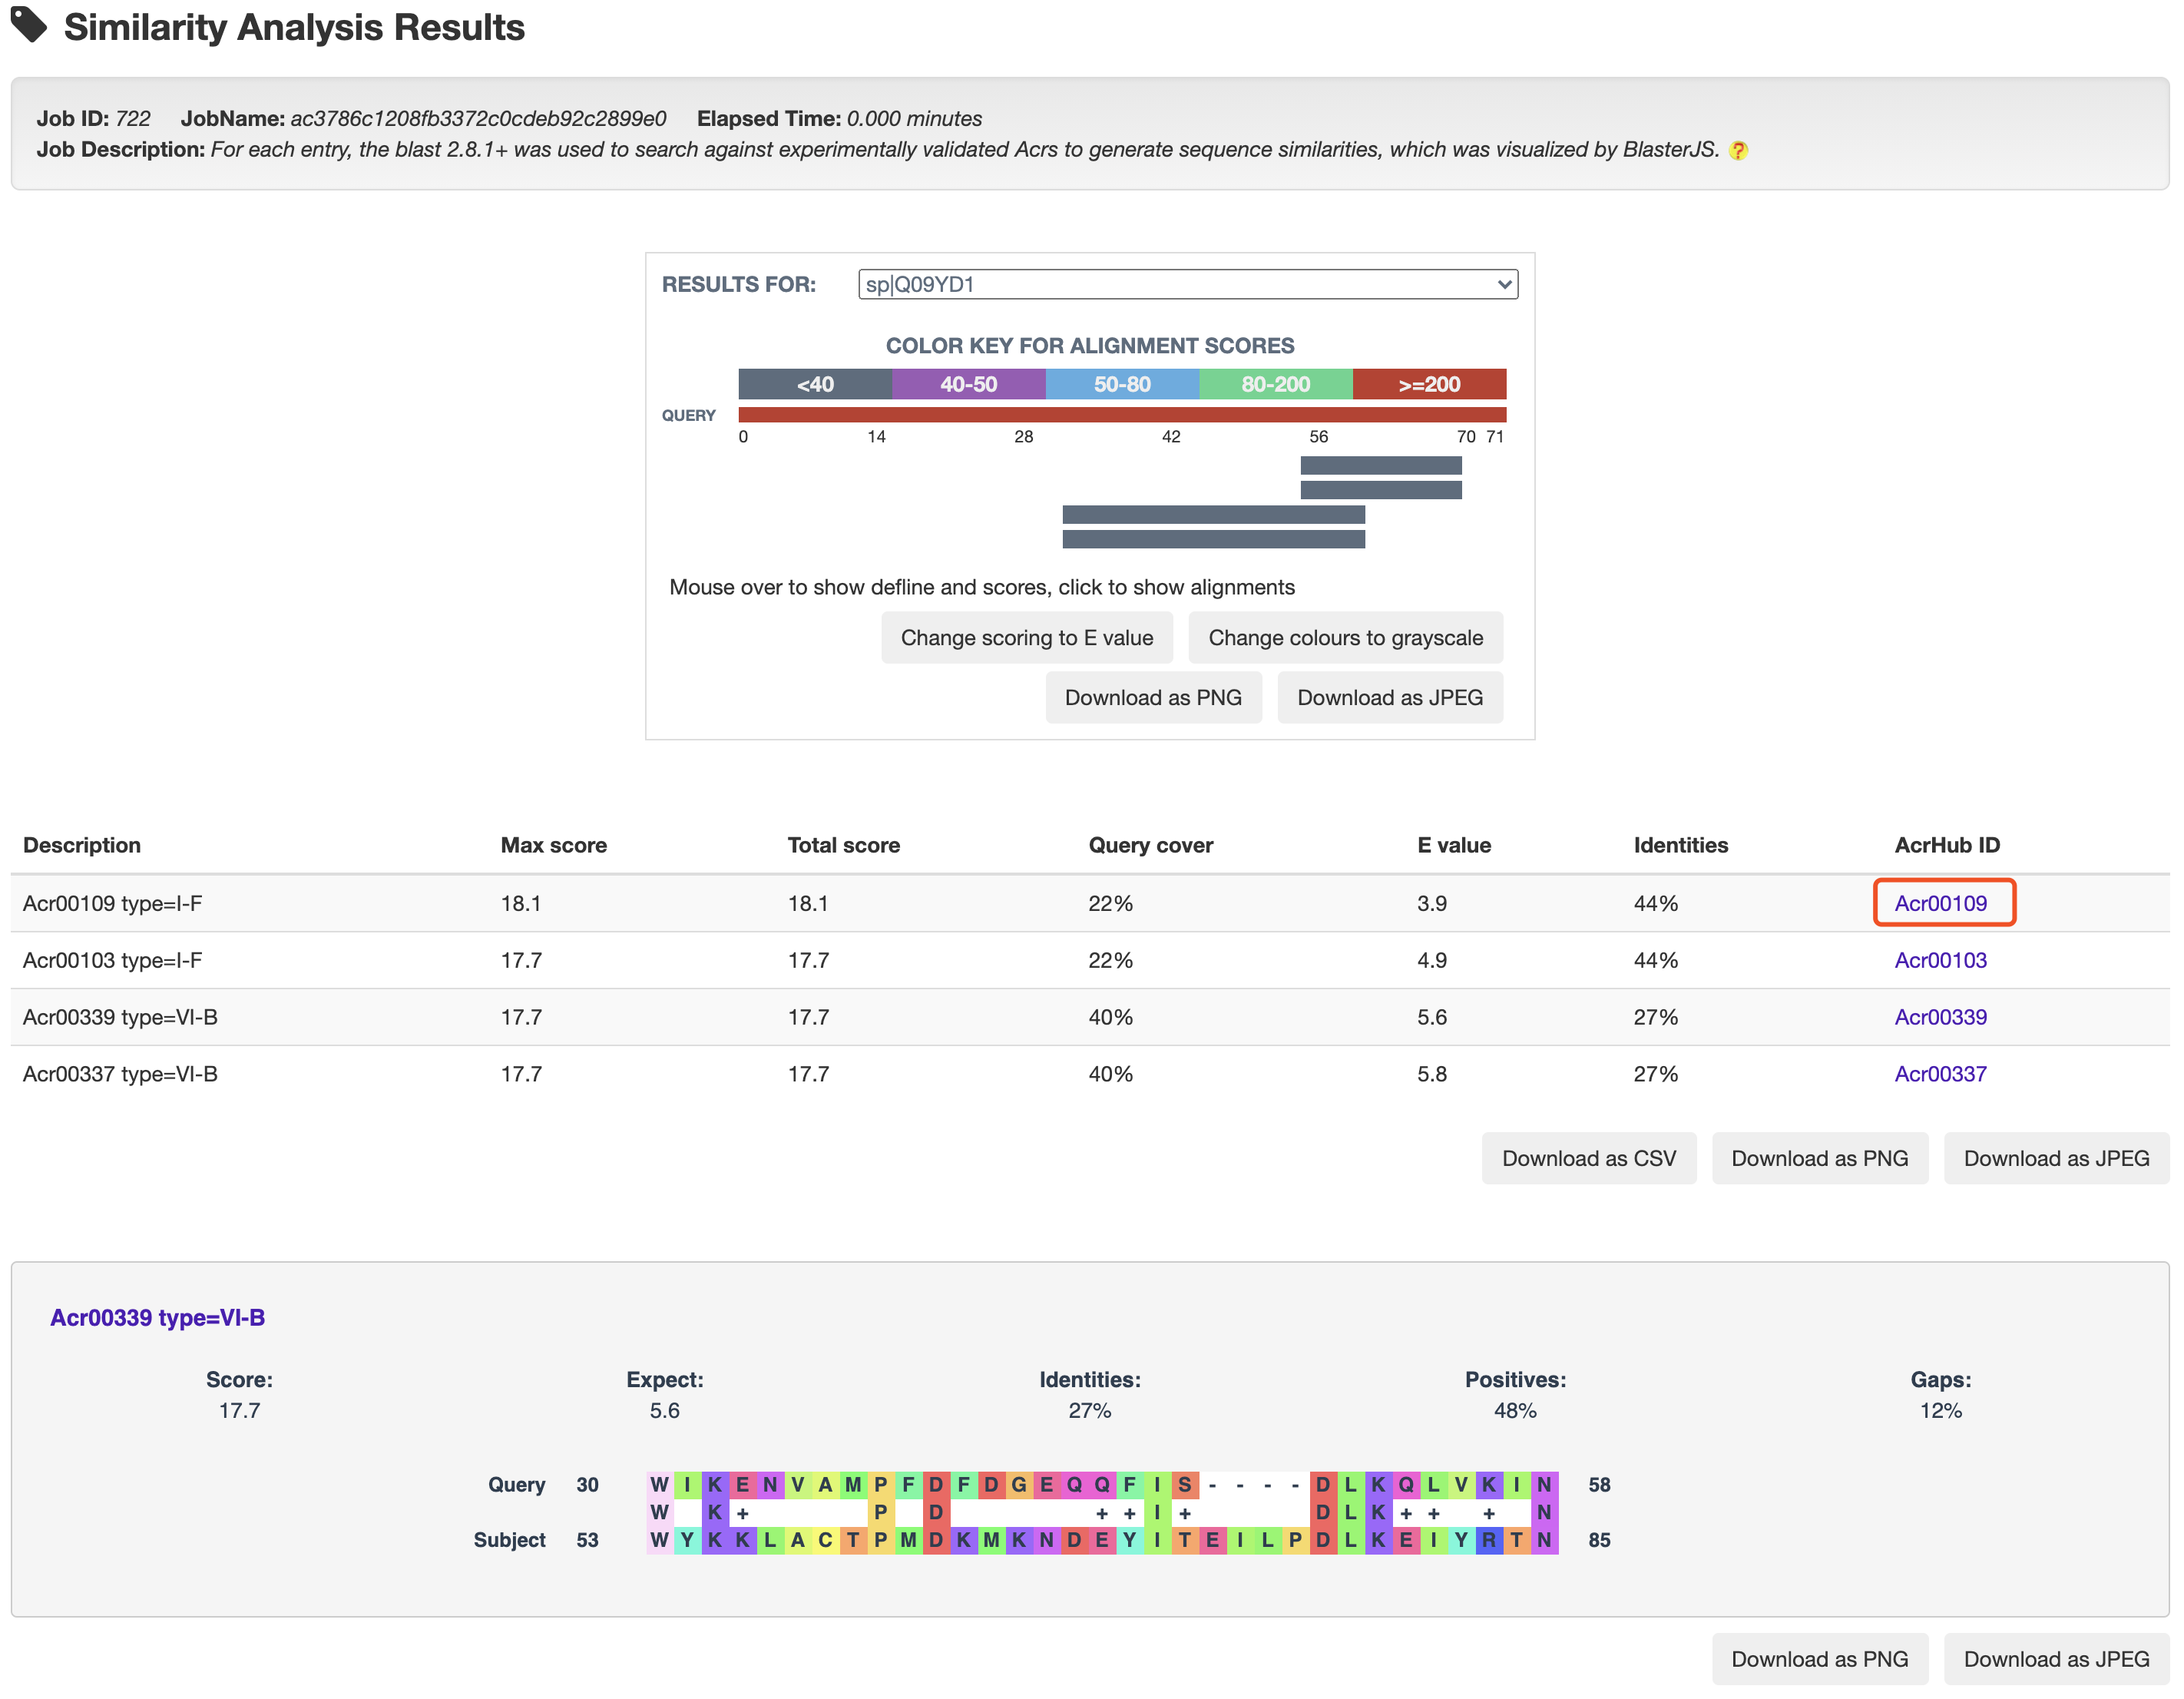
3.1 Similarity analysis
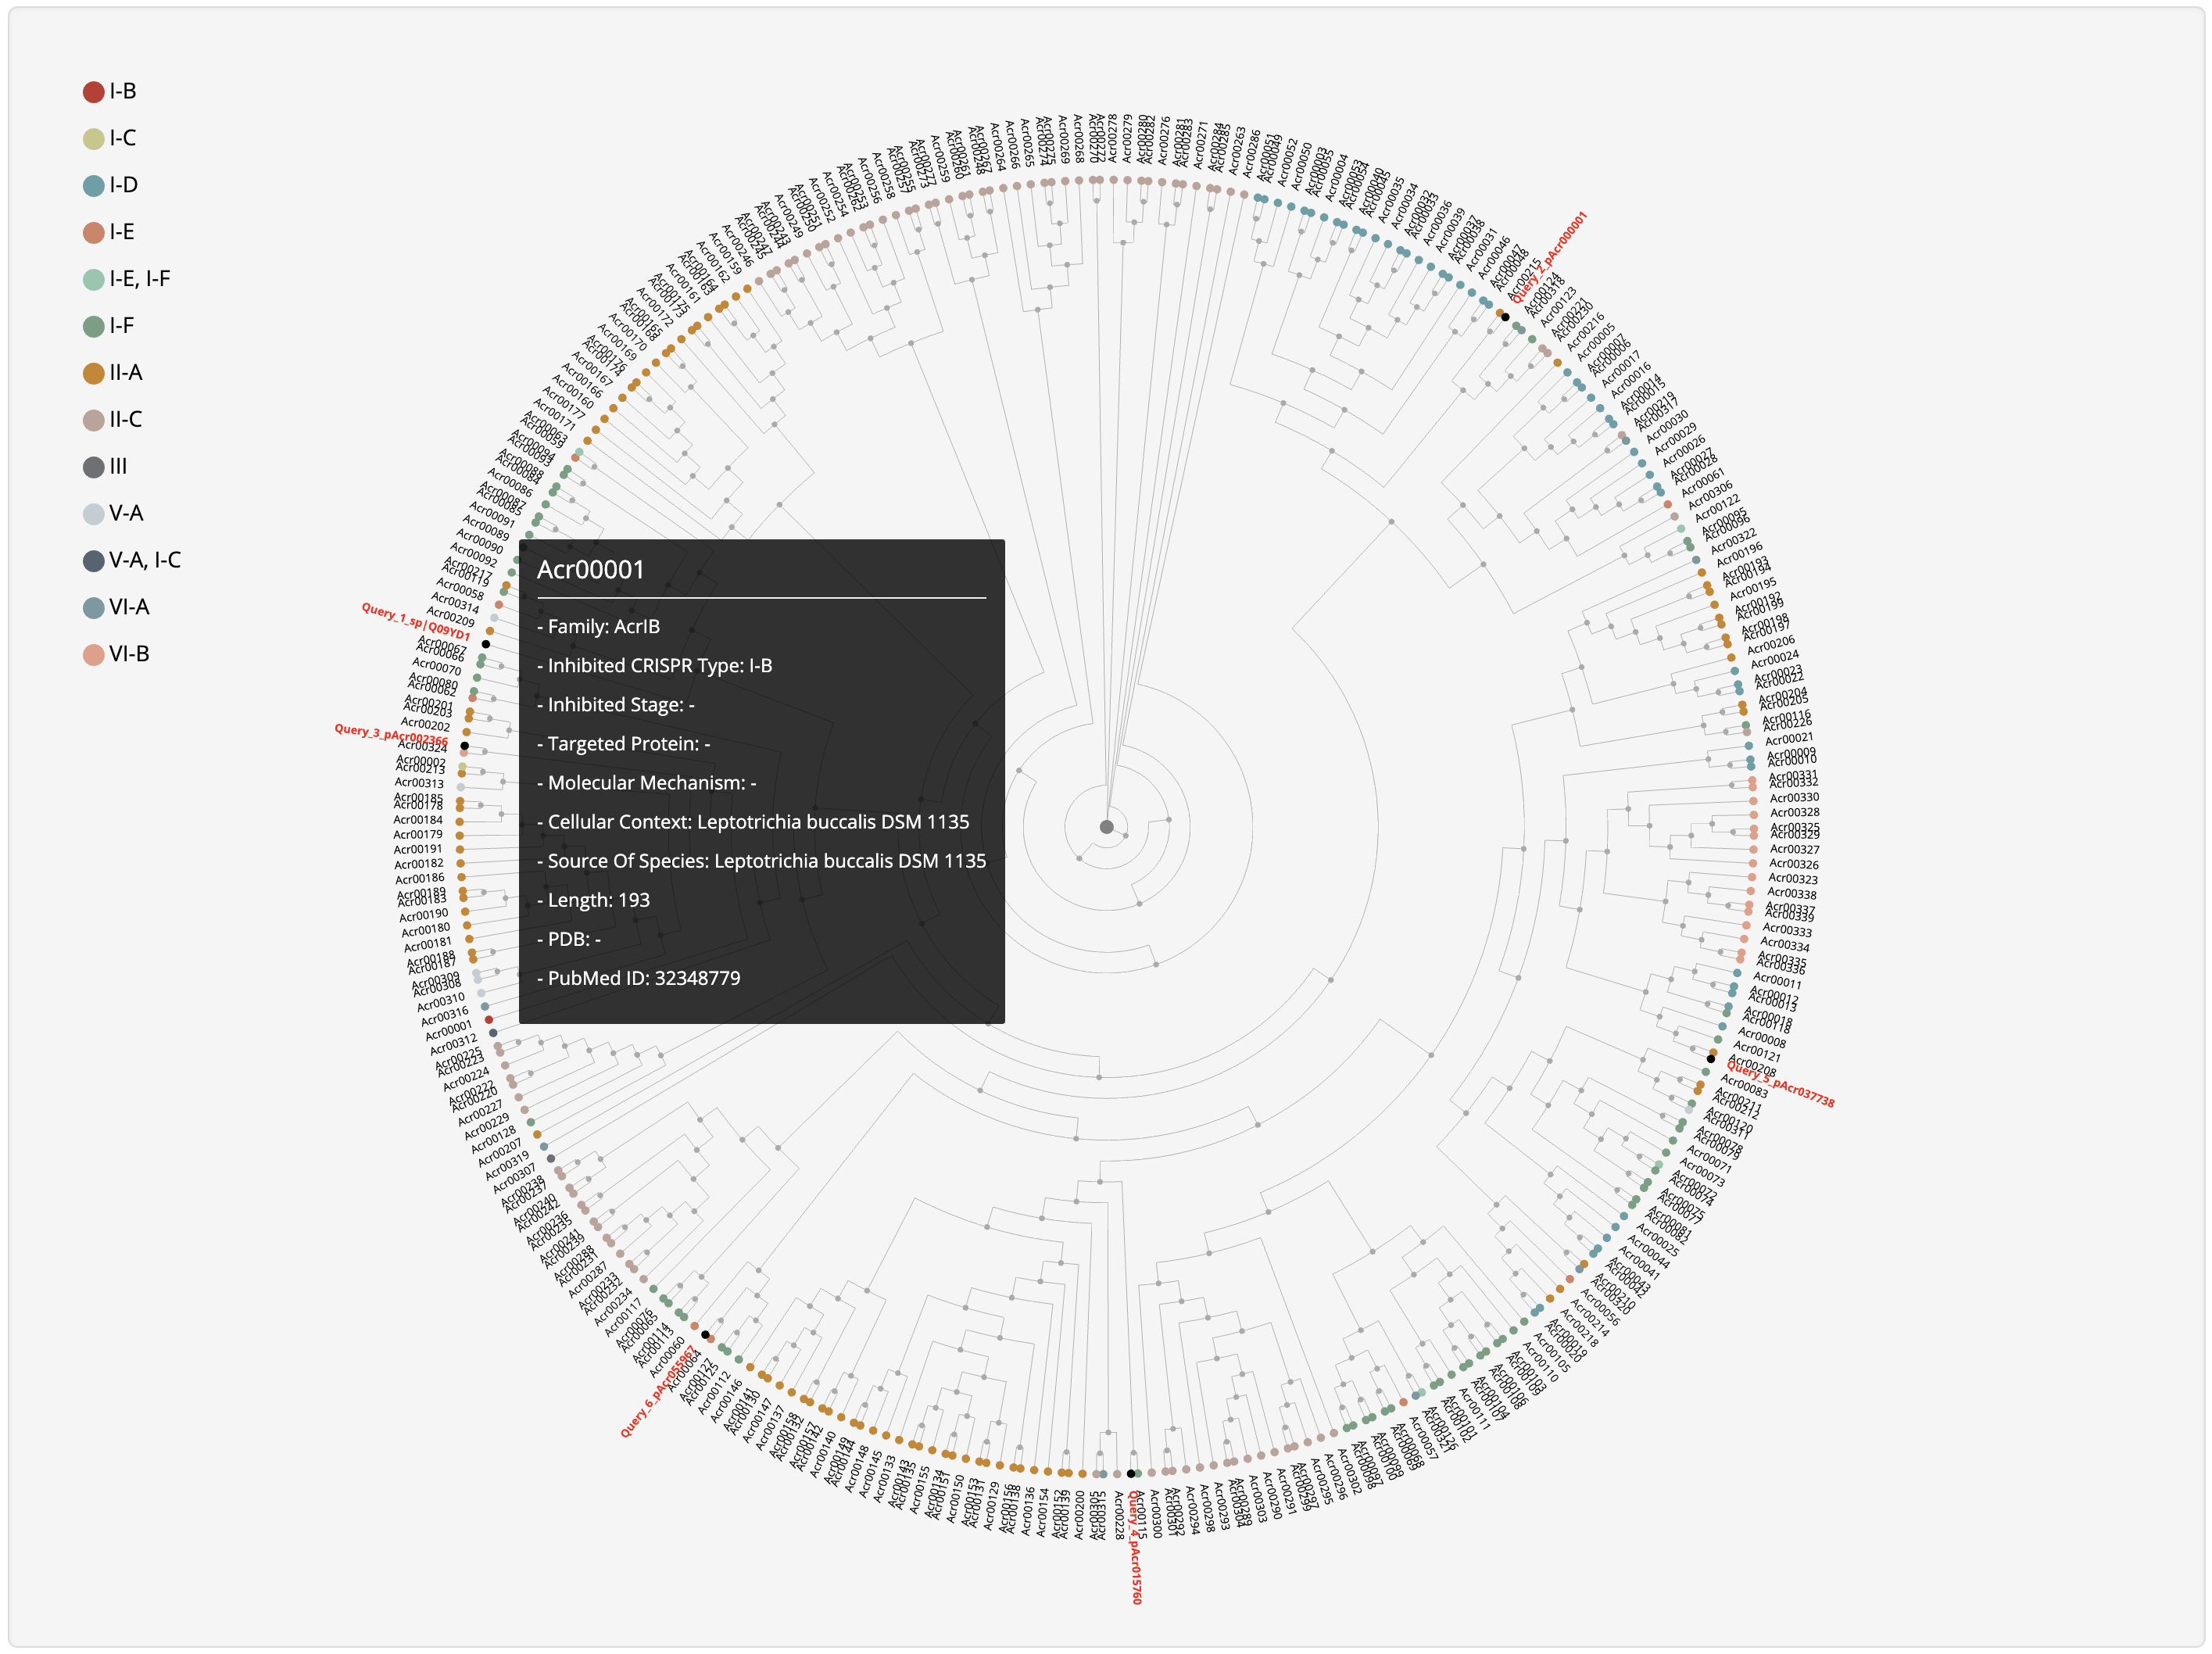
3.2 Phylogenetic analysis
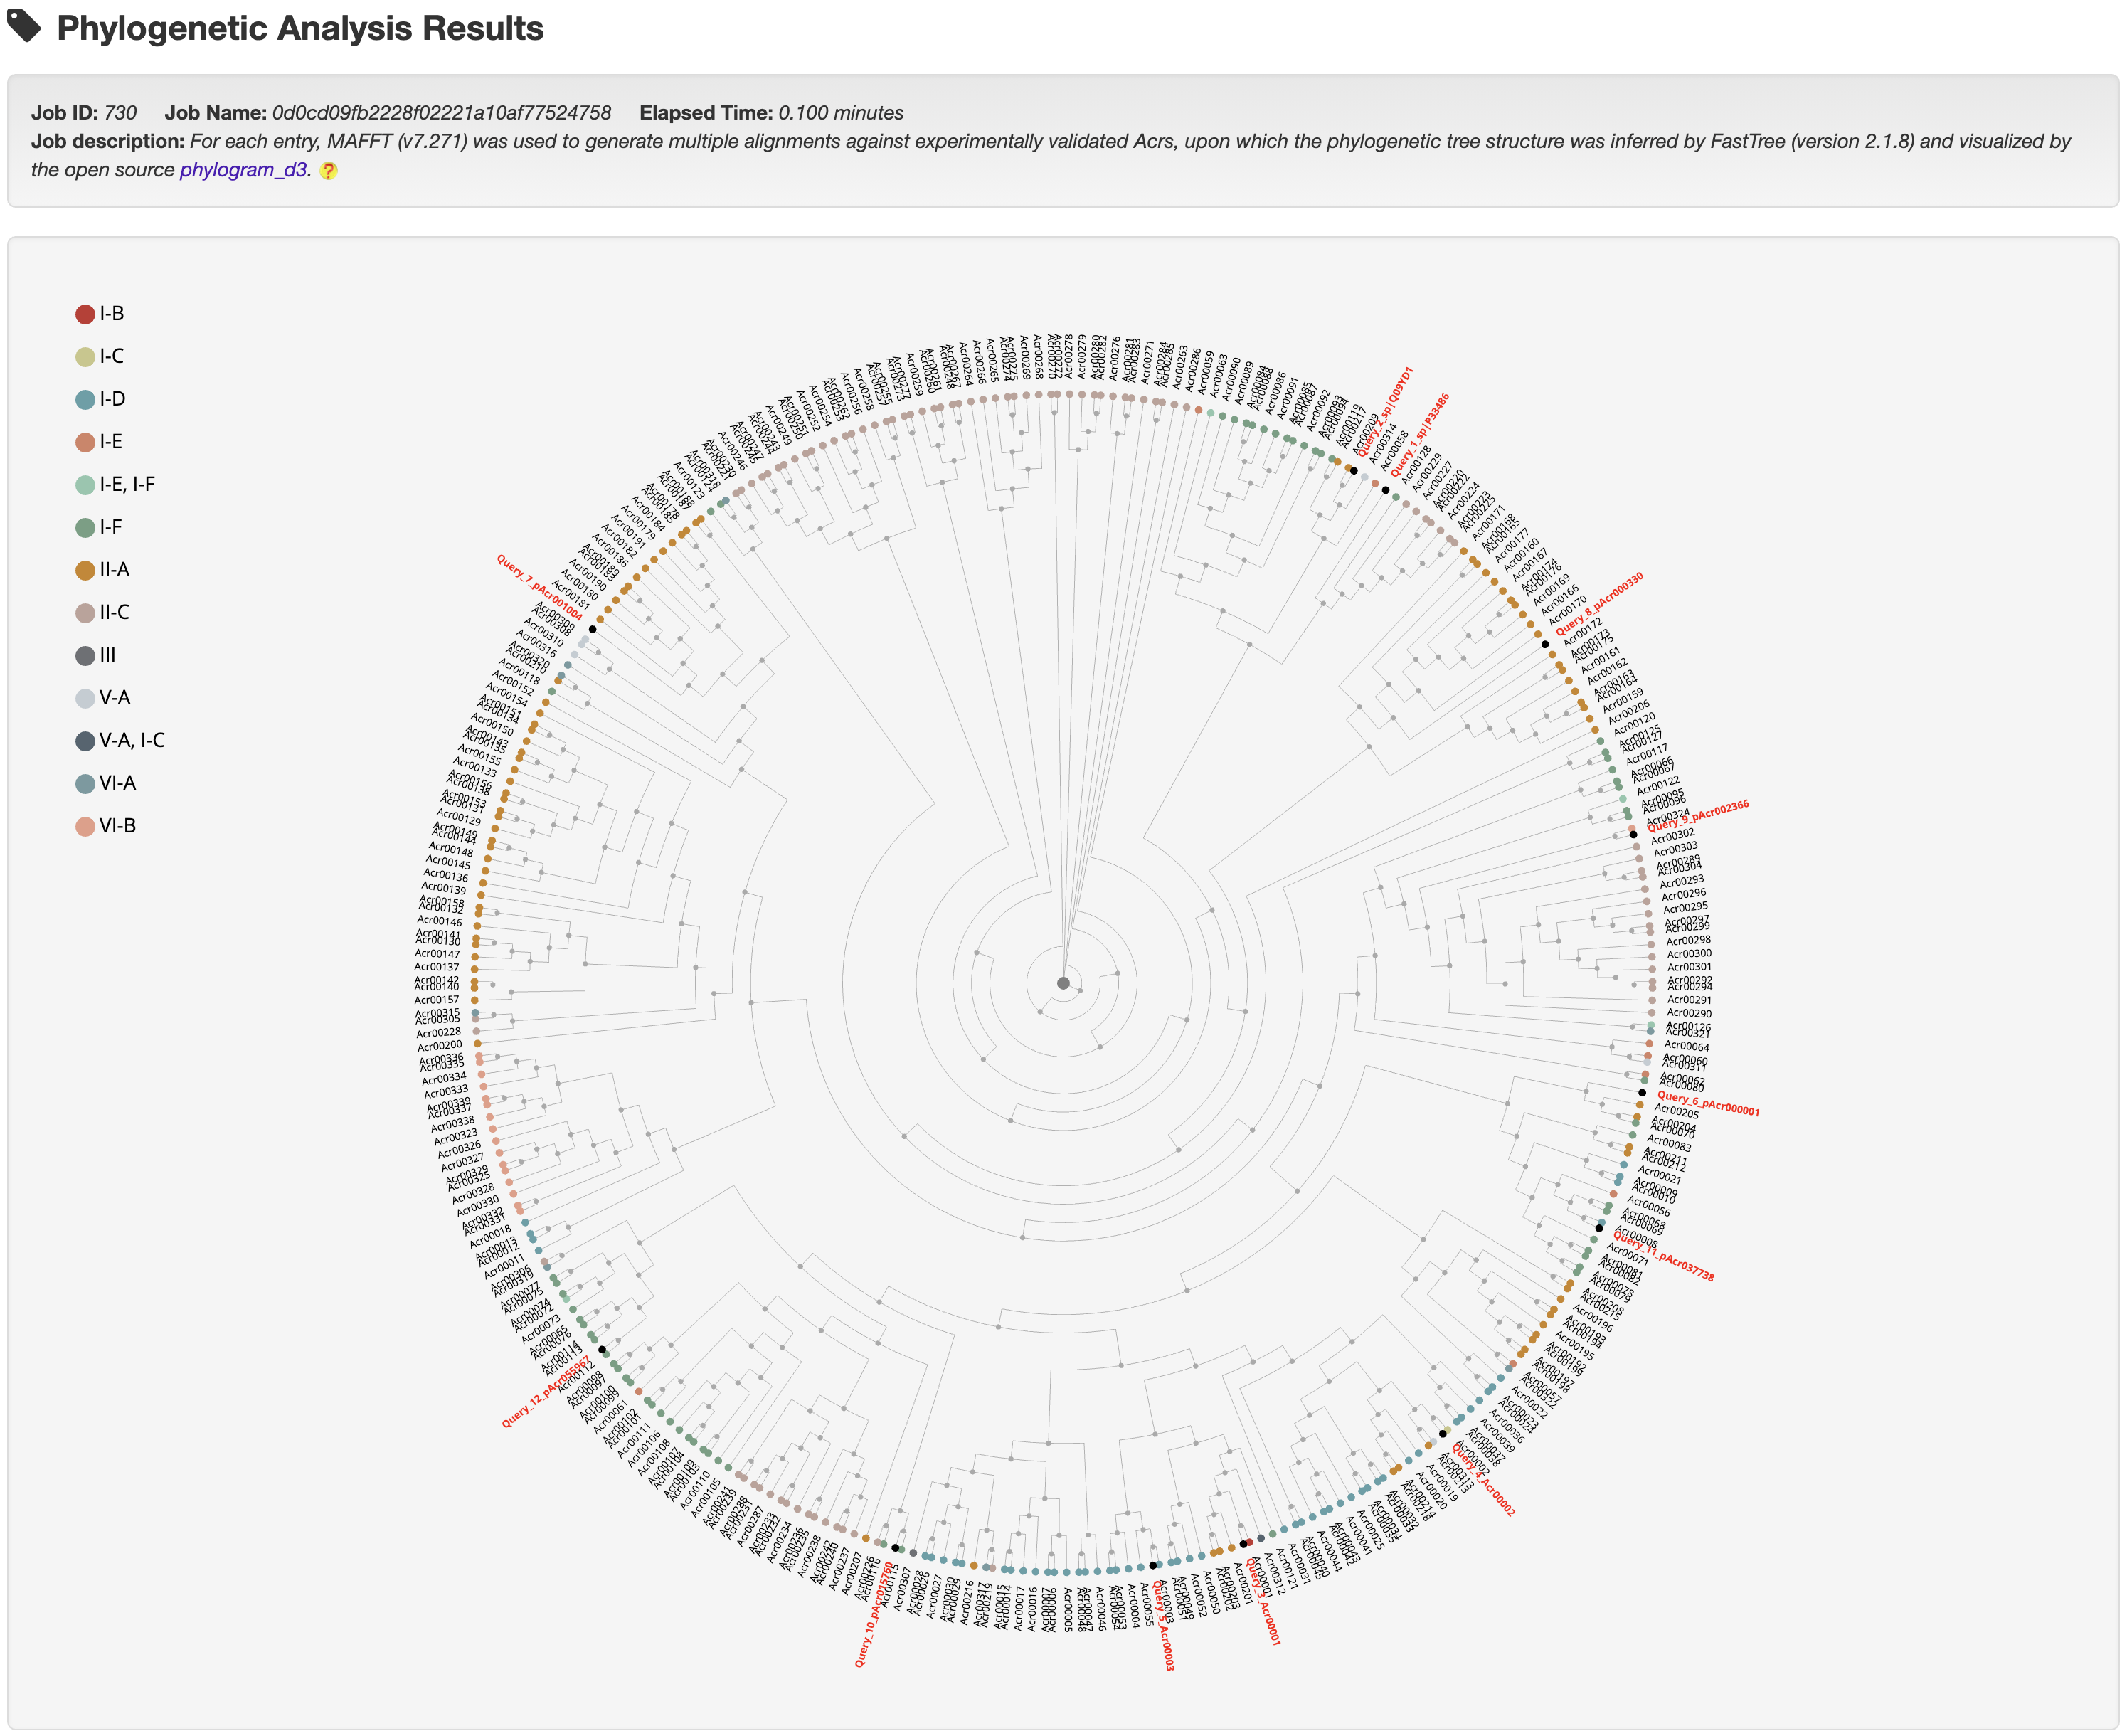
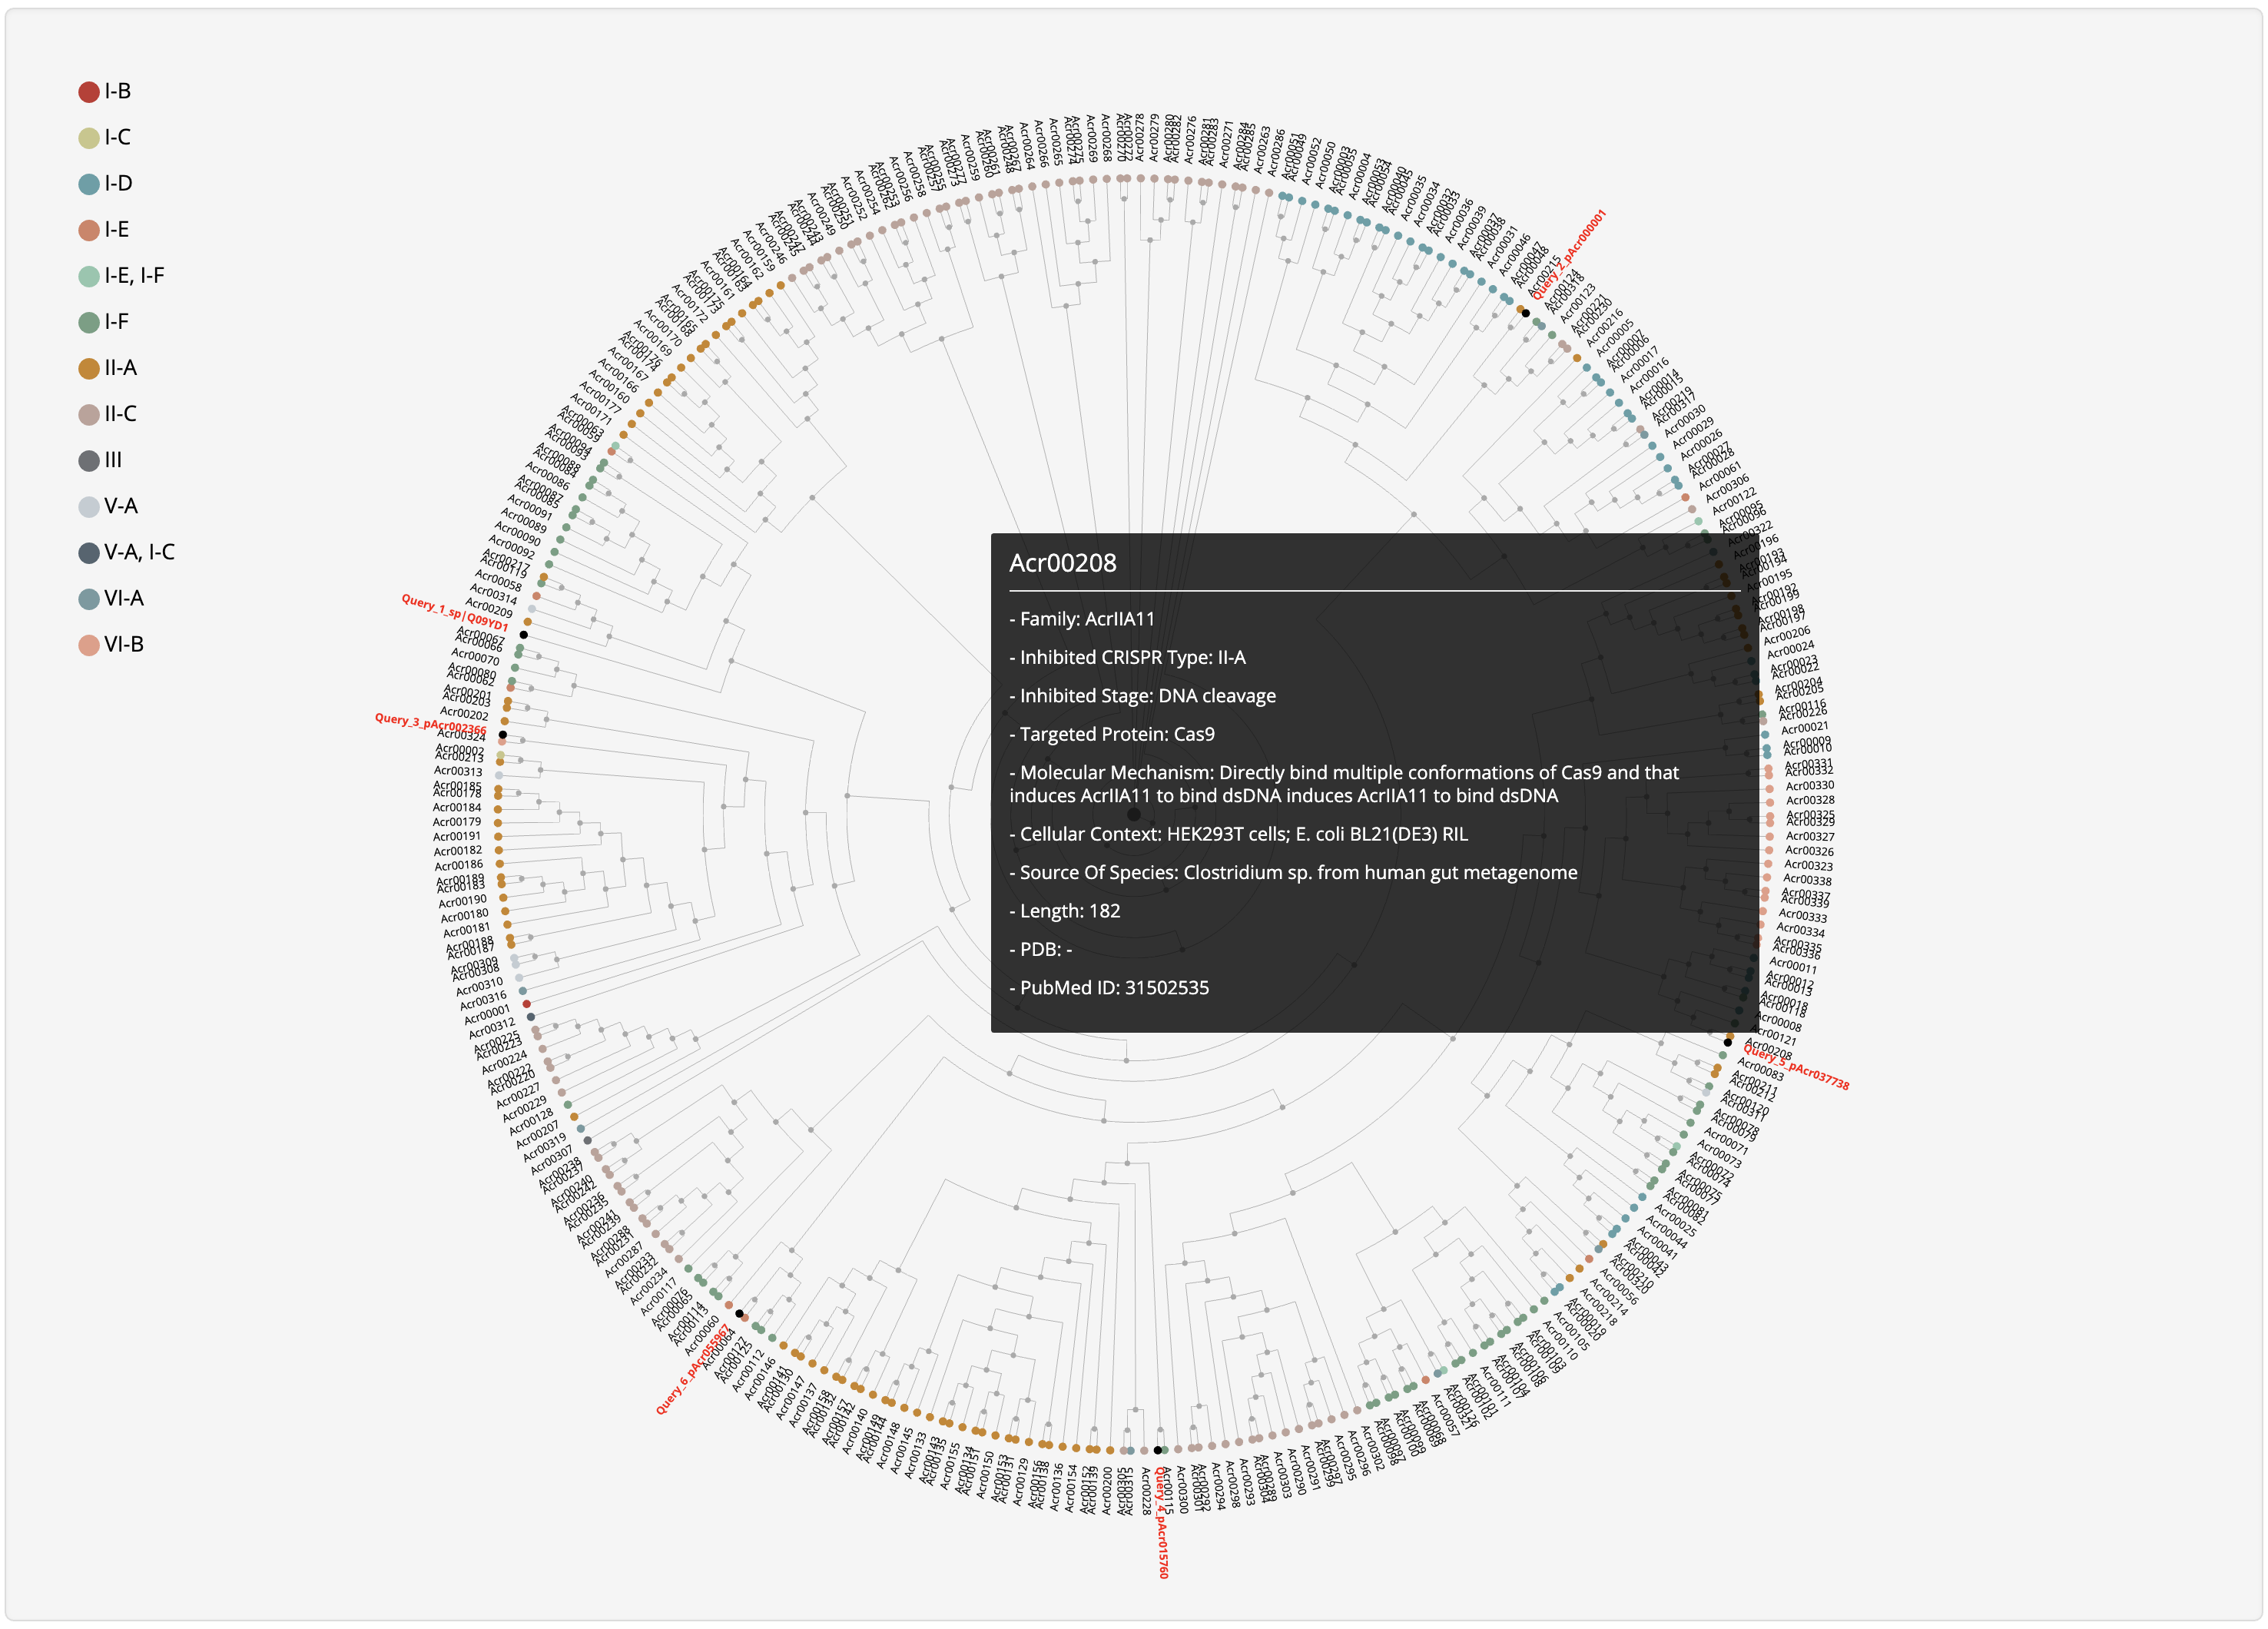
Hover over a node to see its summary information and click it to be redirected to its detailed information page.
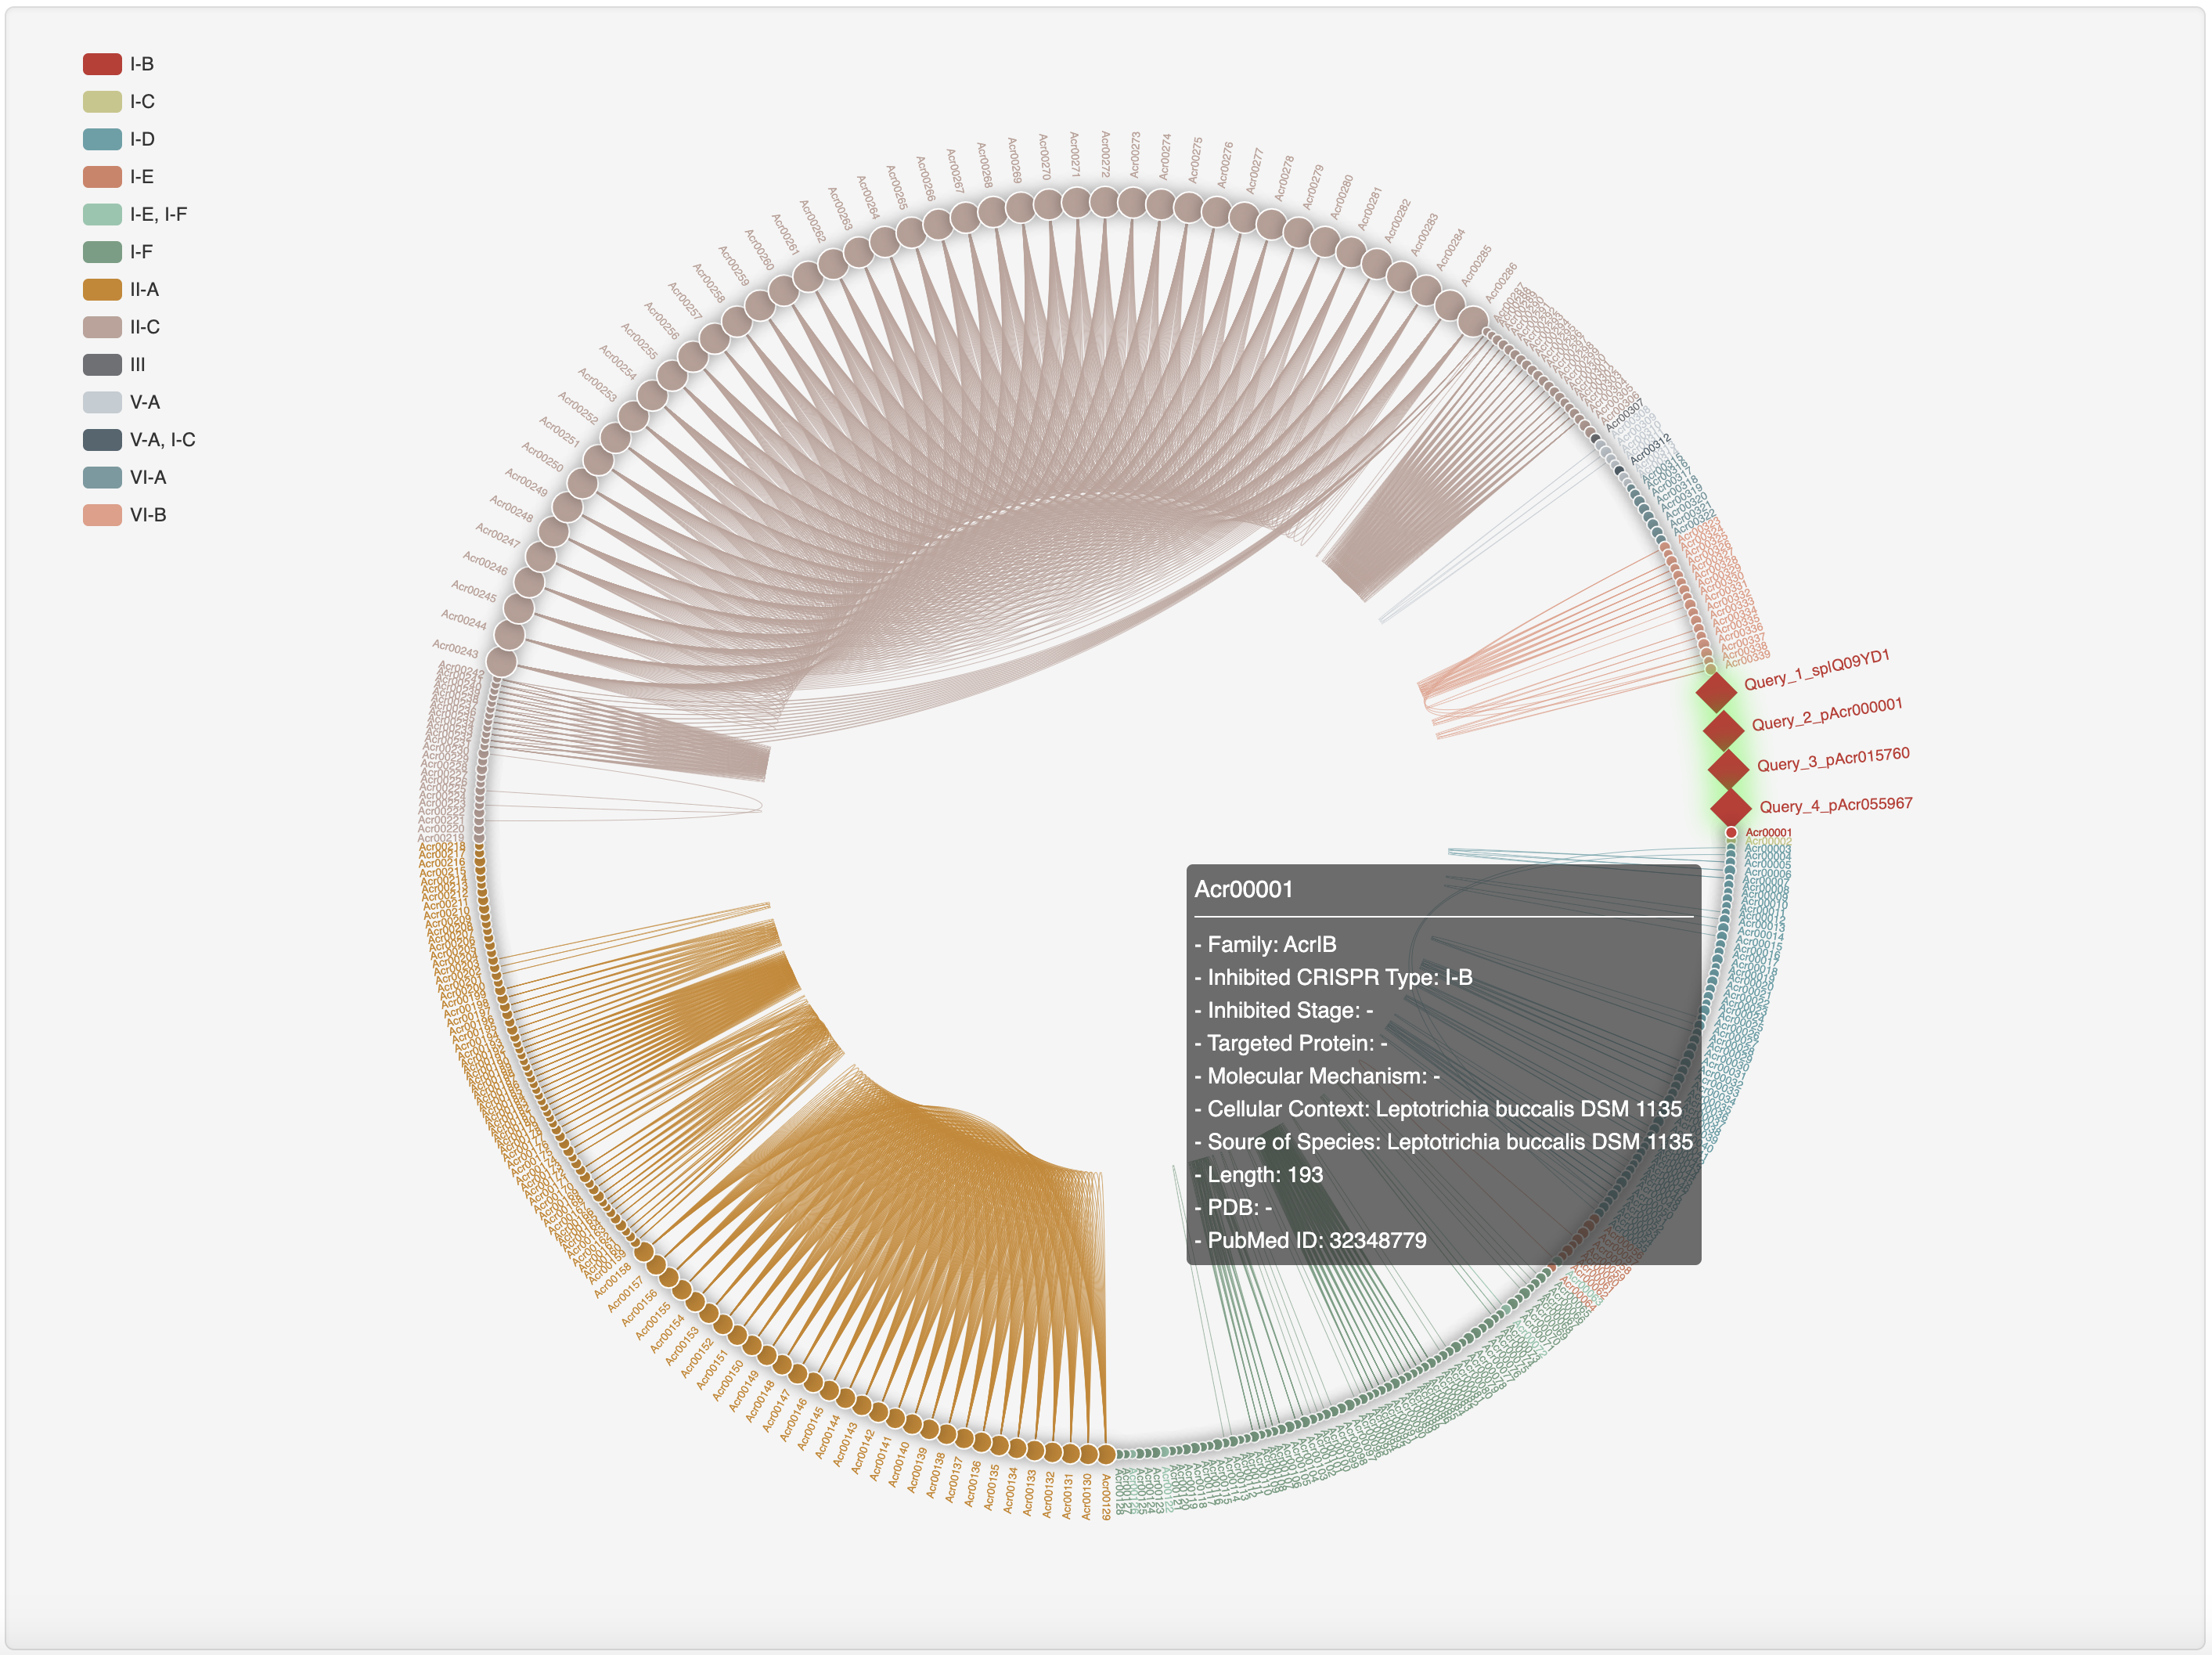
3.3 Homology network analysis
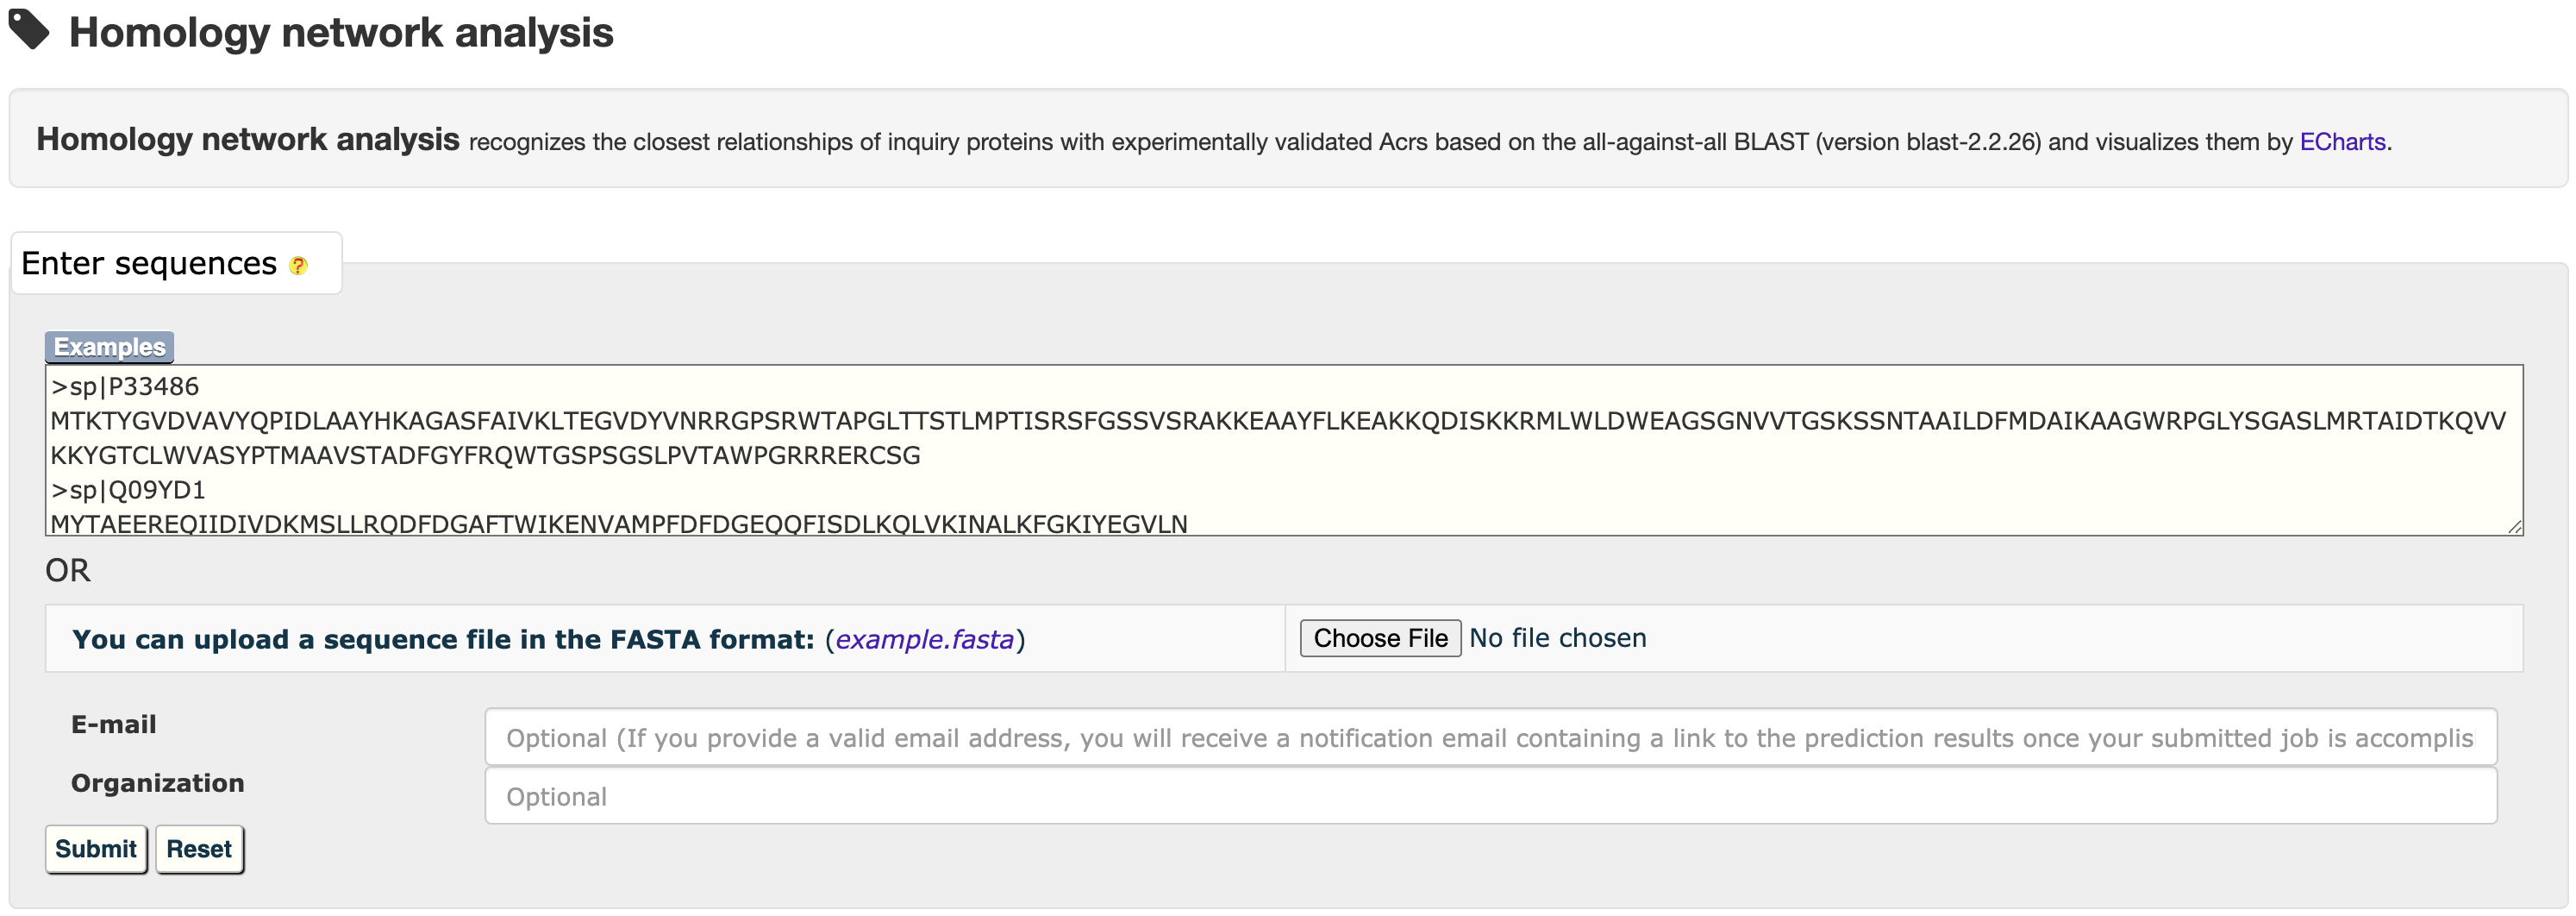
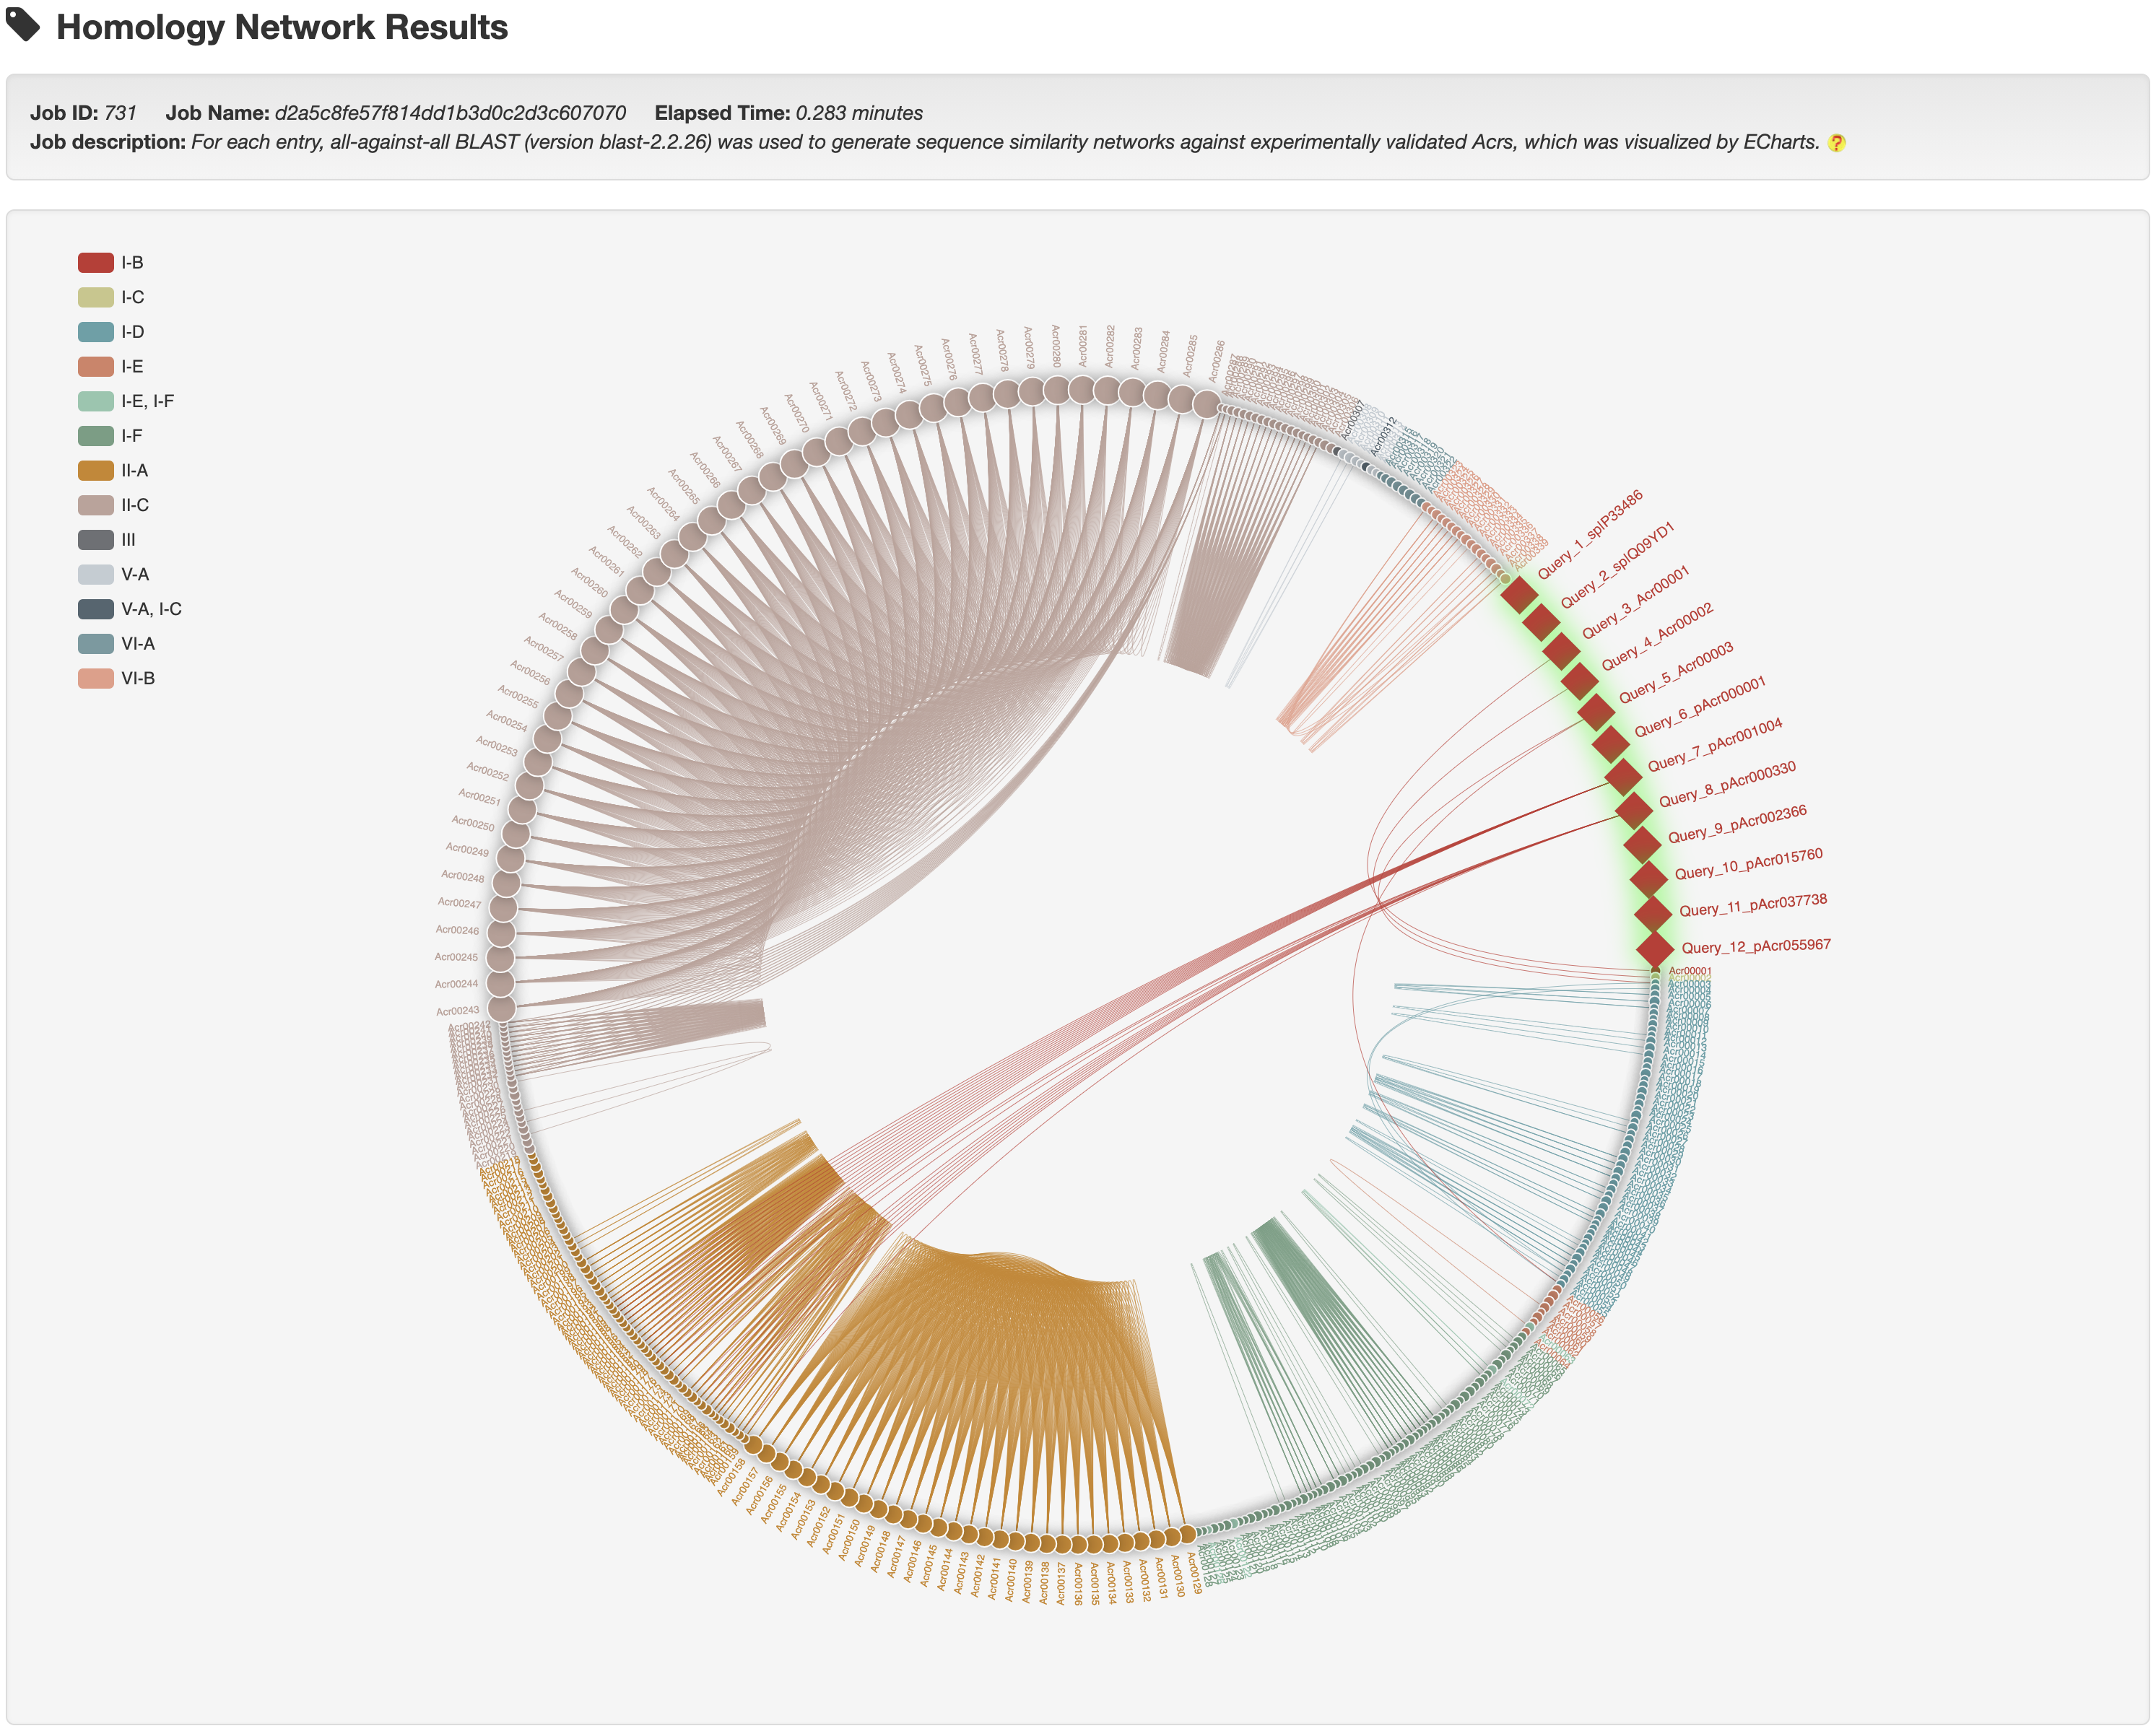
Hover over a node to see its summary information and click it to open a new tab with its detailed information page.
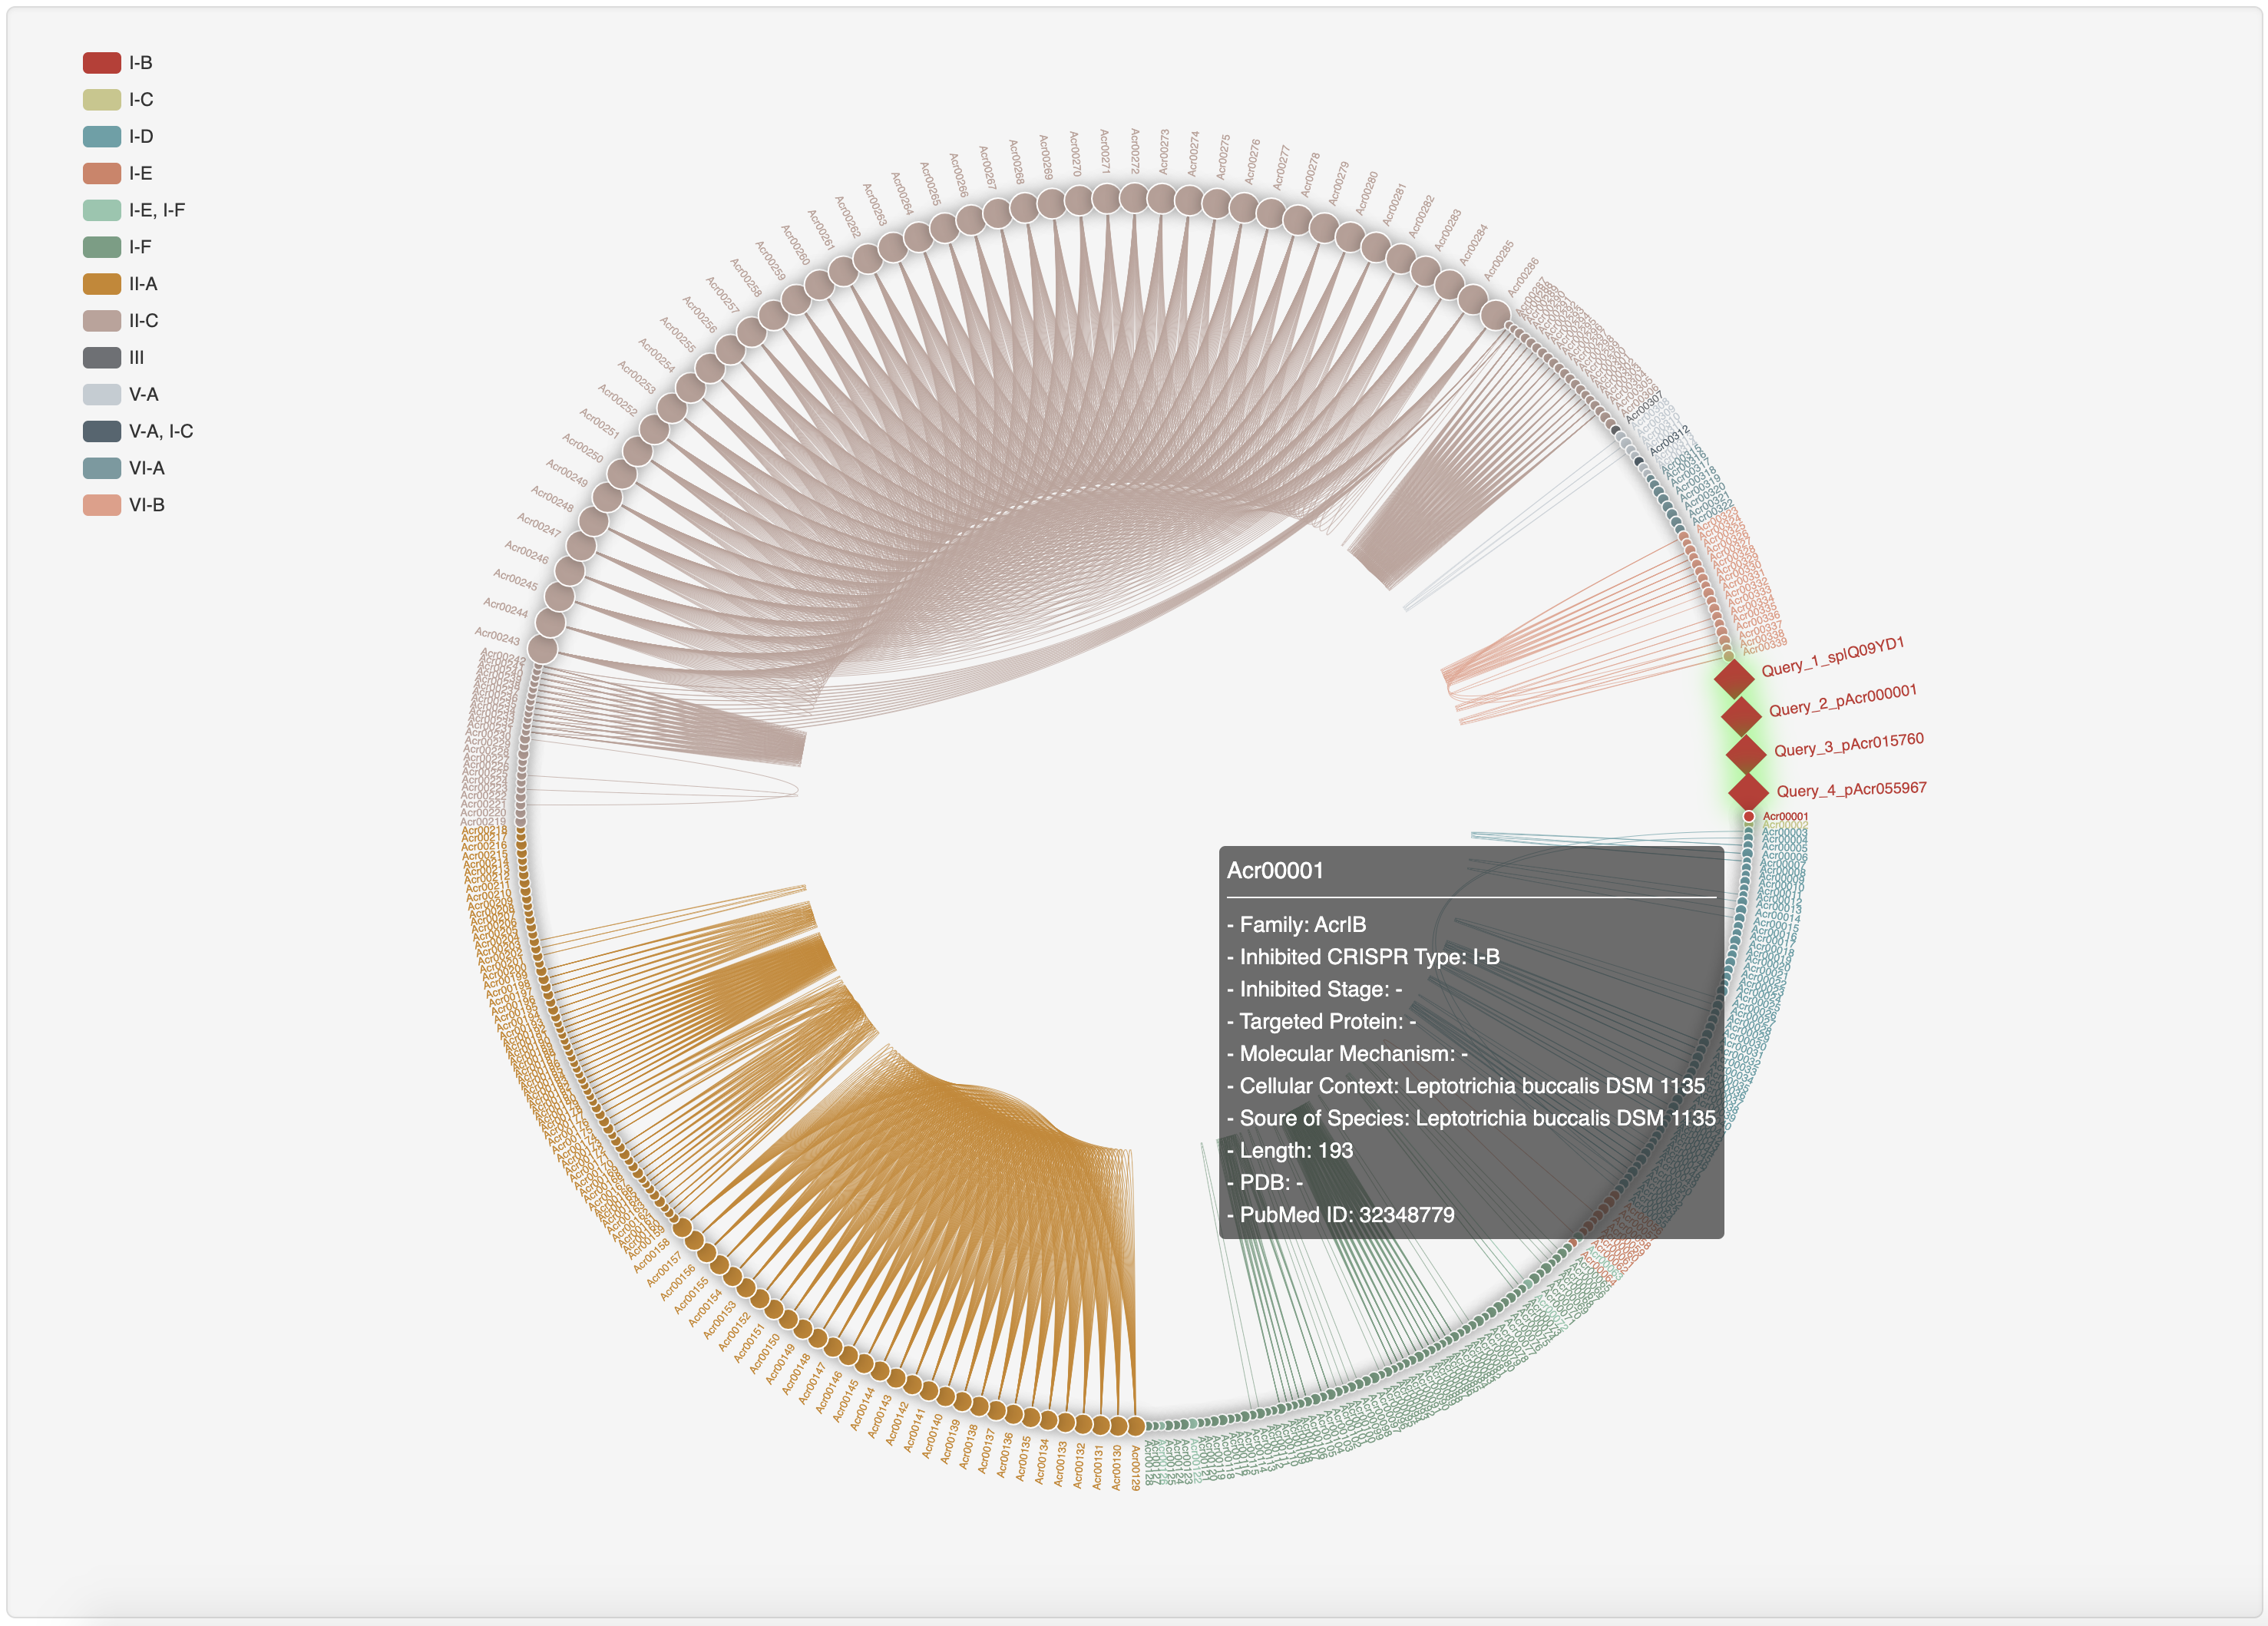
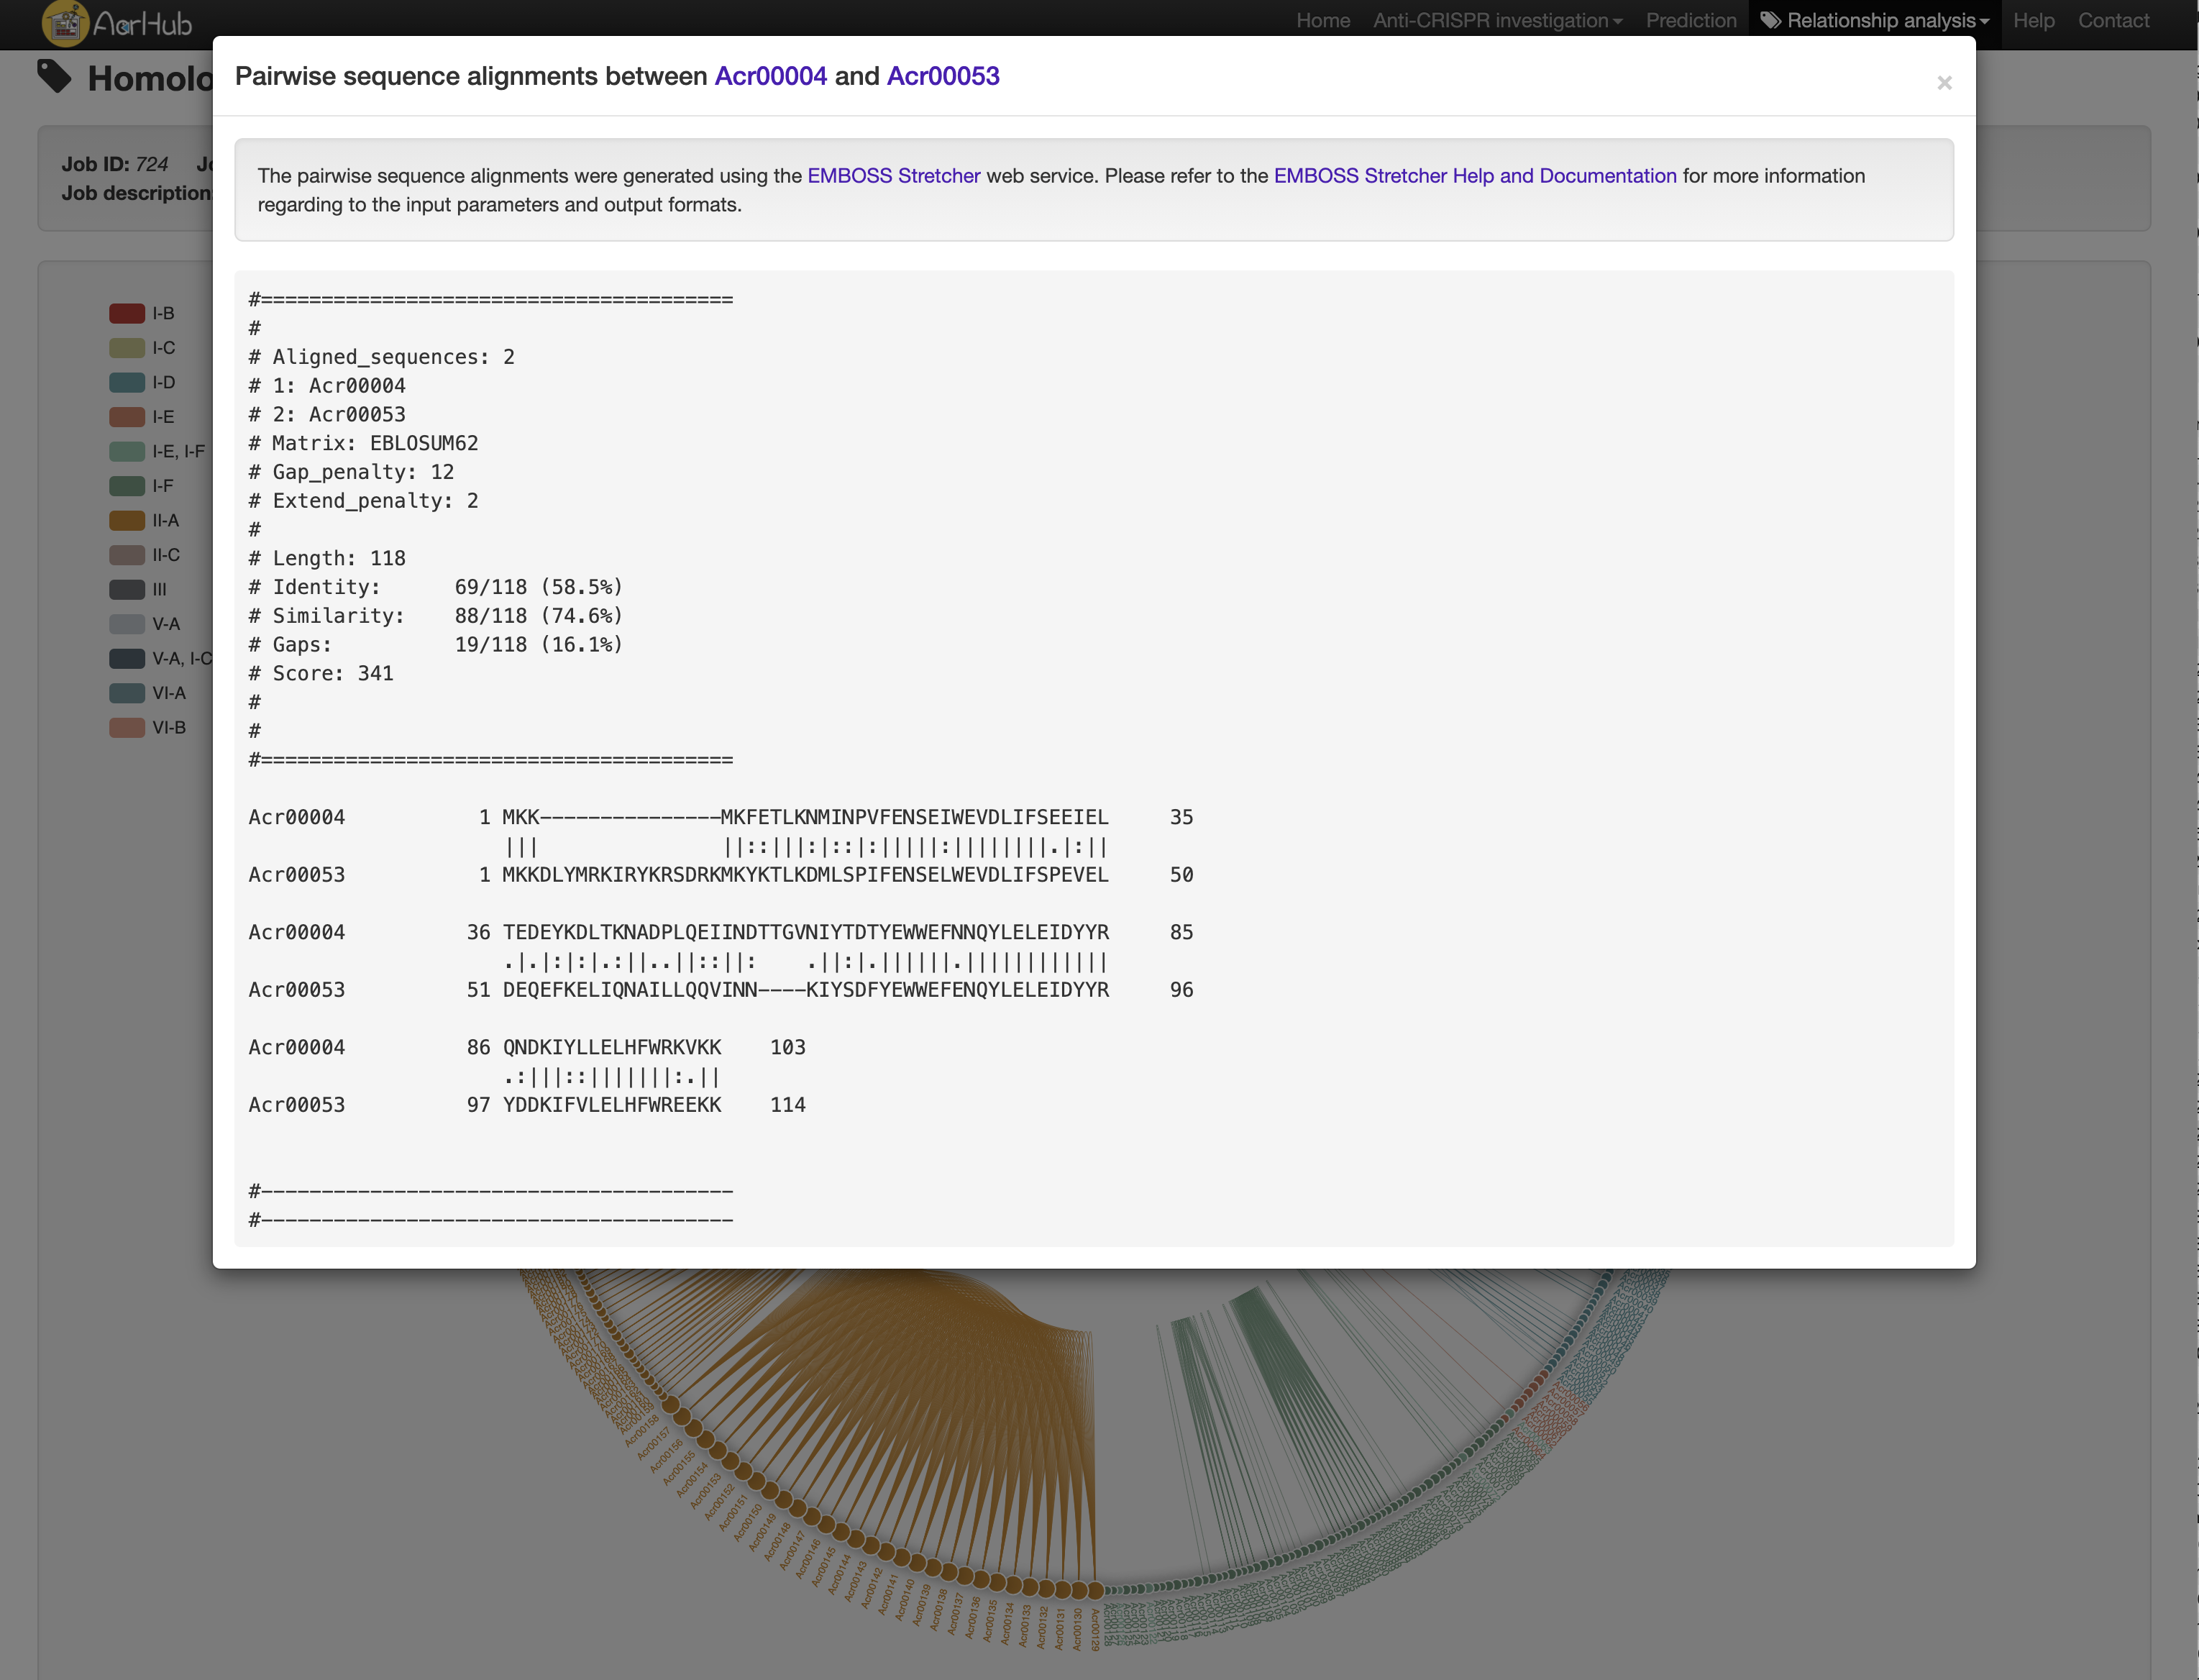
Hover over a homology network link to recognize the linked nodes and click it to see their pairwise sequence alignments.
4. ANALYSIS PIPELINES
AcrHub provides options for users redirect prediction results to relationship analysis easily, and access detailed information of homologous known Acrs for inquiry proteins.
4.1 From prediction to relationship
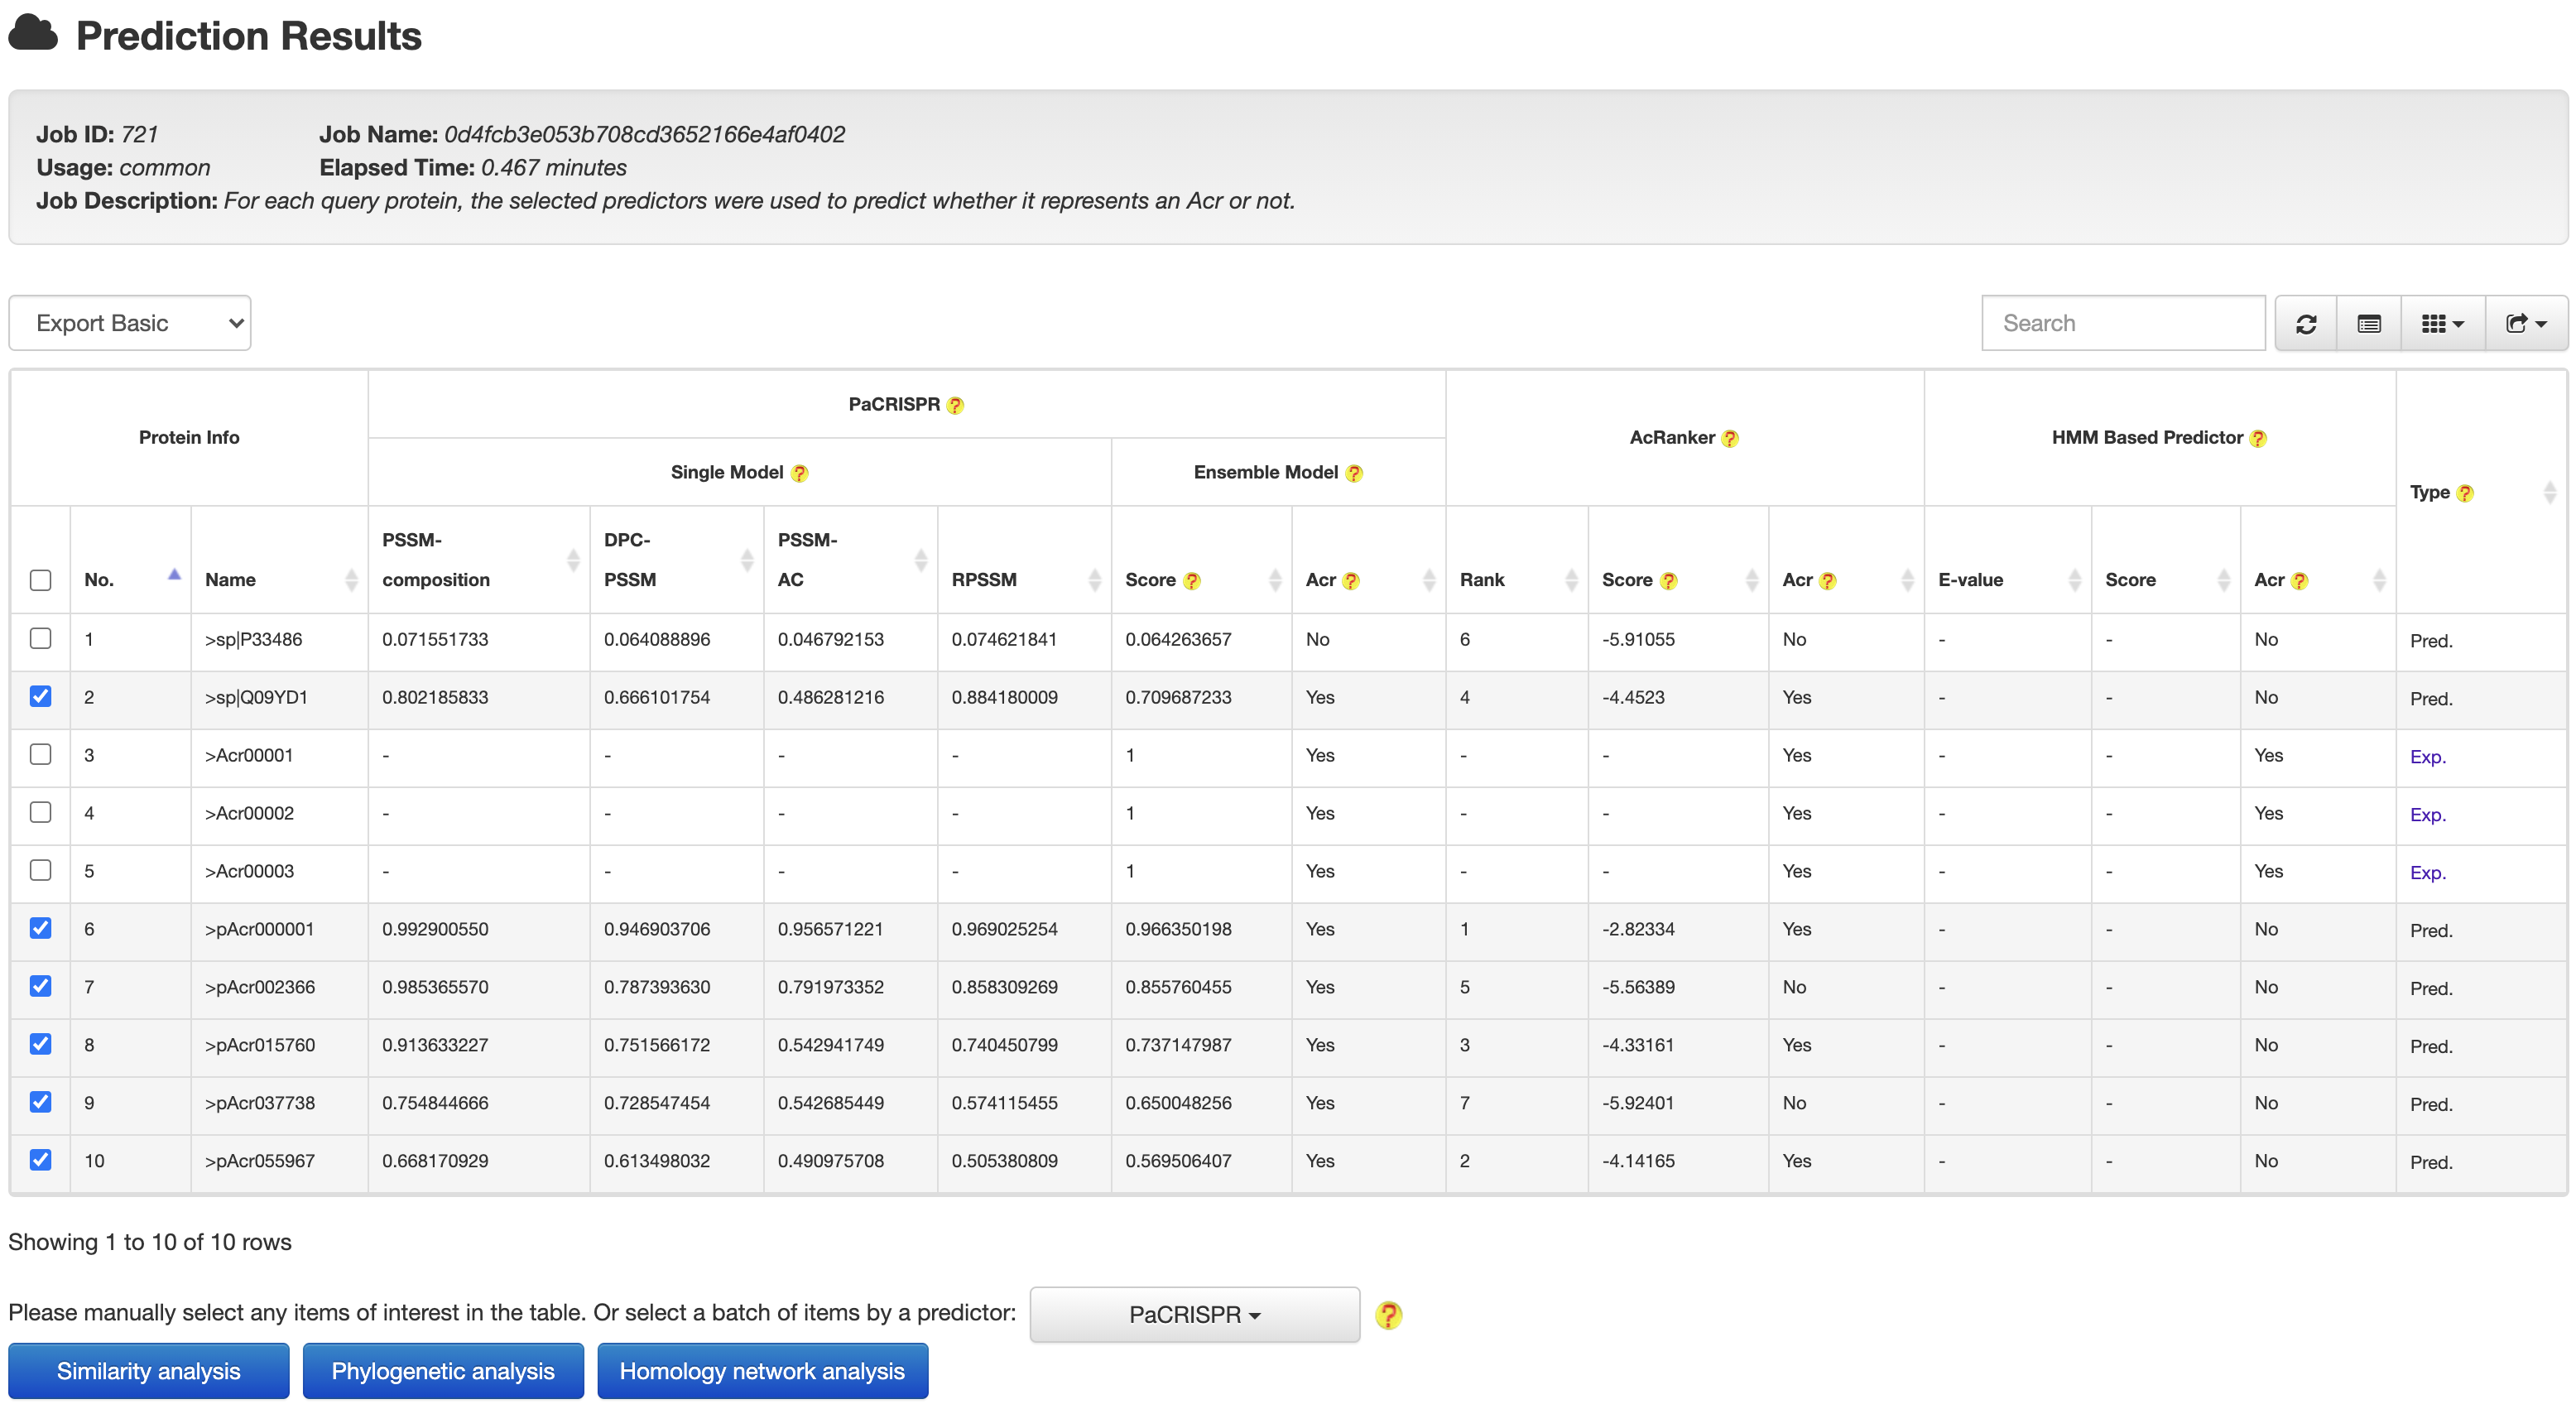
At the prediction results page, users could easily selected a set of target proteins, and redirected them into a relationship analysis module.
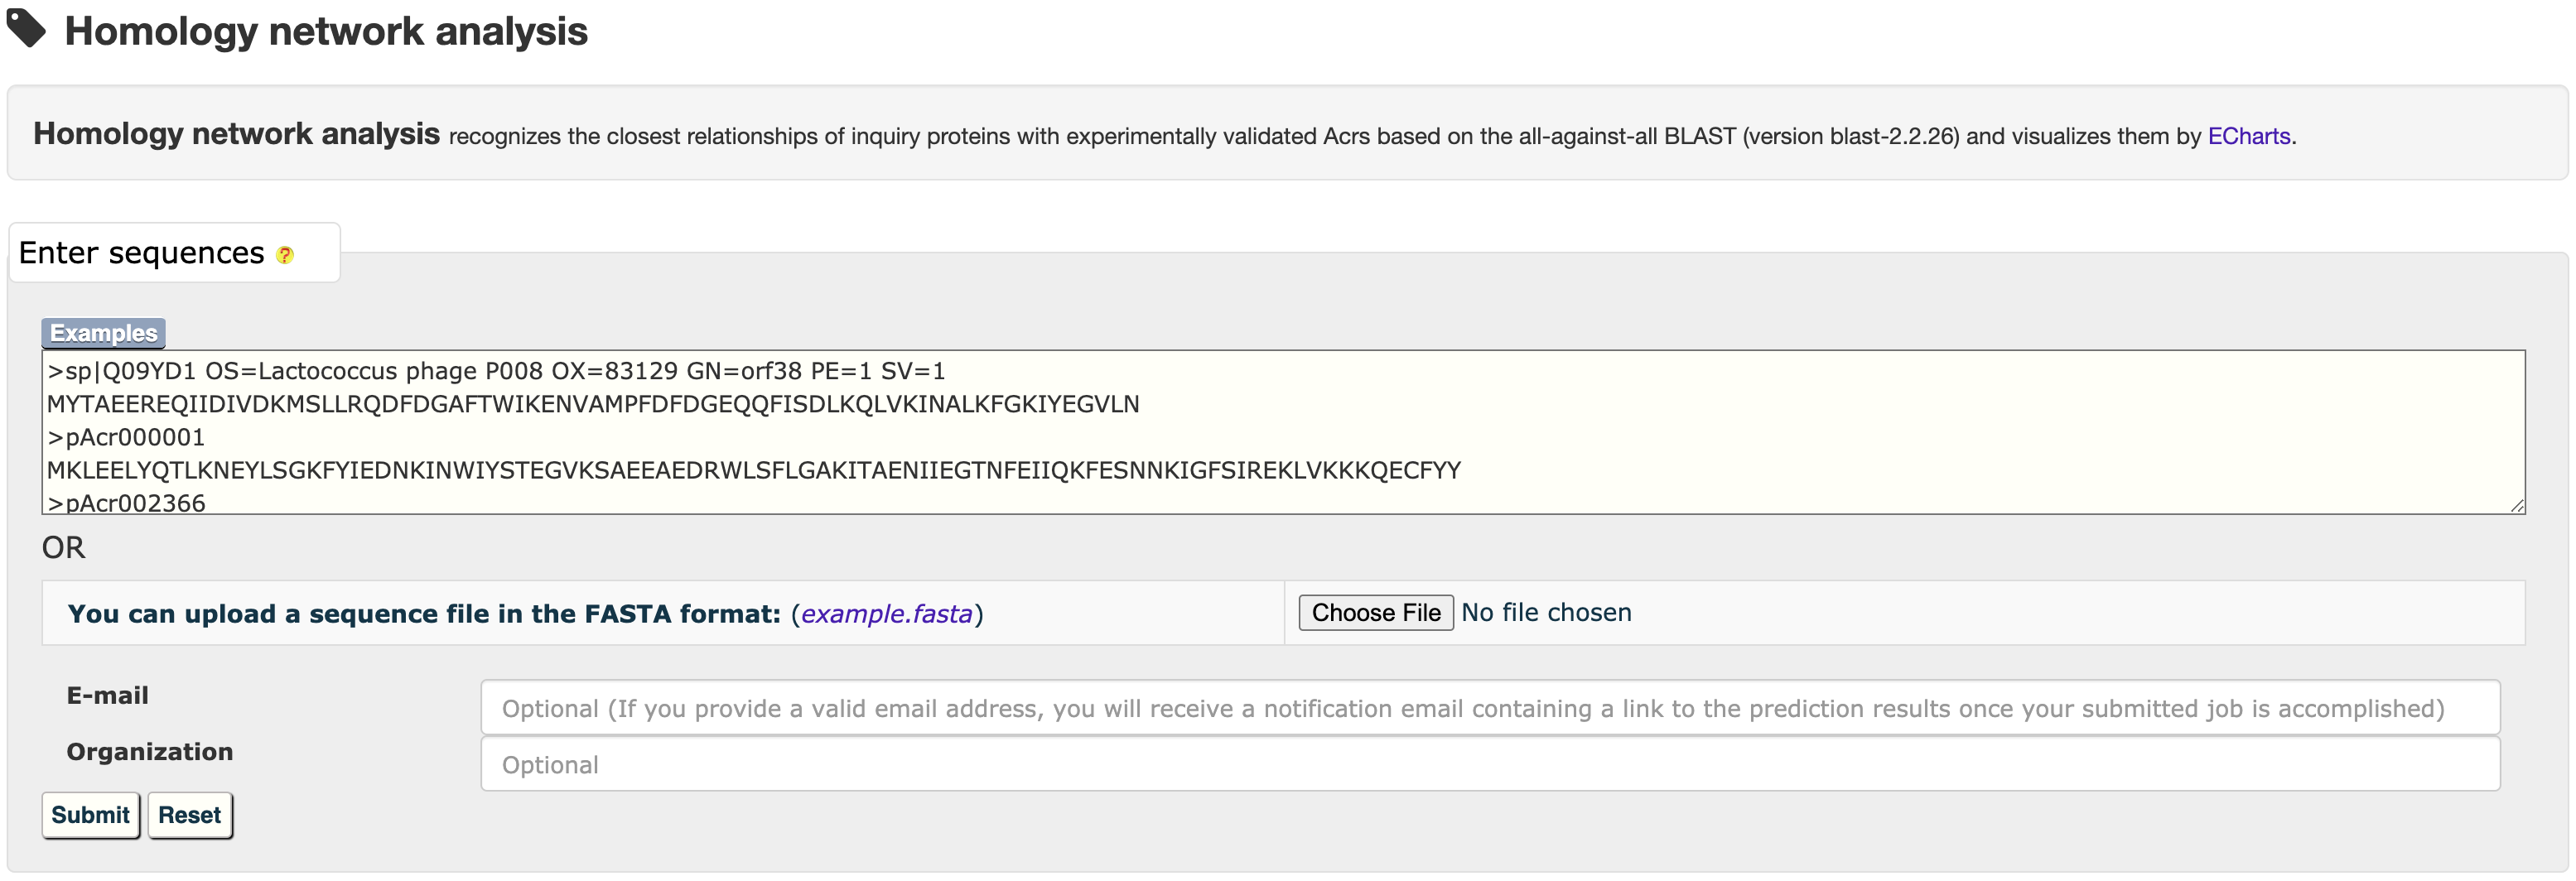
and then get the relationship analysis results:
4.2 From results to known Acrs
At the prediction or relationship analysis results pages, users could click links (presented in the following figures)
to access the detailed information of associated known Acrs.
